Fig. 3.
Download original image
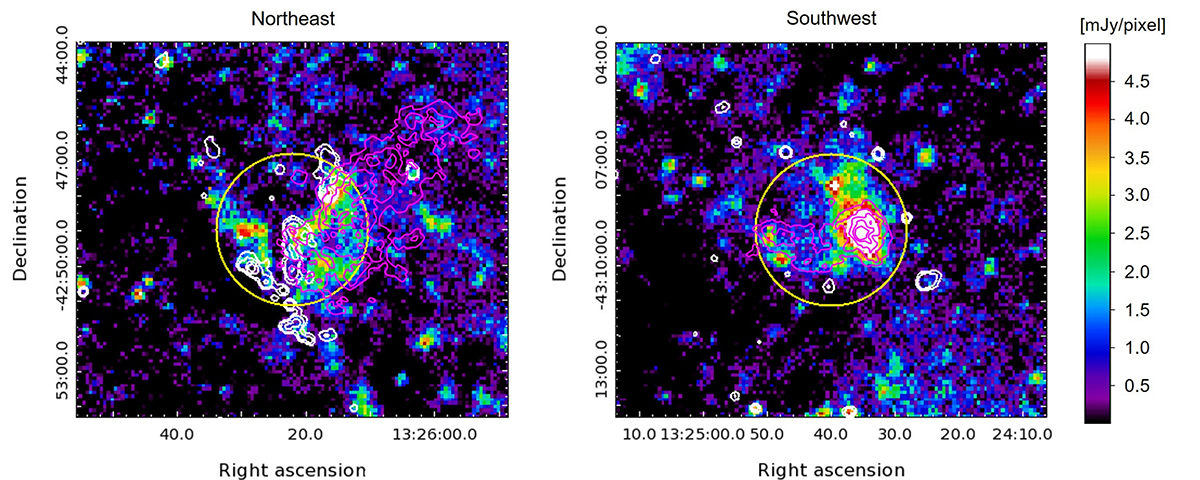
Photometry fields of (left) the northeast and (right) the southwest region of Cen A. The background color images are sky-subtracted Herschel 250 μm maps, where the color scales are the same for both images. The yellow circles are the adopted photometry apertures. The magenta contours show the H I column density, where the contour levels correspond to 1, 5, 10, 15, and 20 × 1020 cm−2 (Auld et al. 2012; the same as in Fig. 1). The white contours show the GALEX/FUV intensity distribution, where the contour levels correspond to 0.0017, 0.002, 0.0035, and 0.006 ct s−1 per 1.5 arcsec2.
Current usage metrics show cumulative count of Article Views (full-text article views including HTML views, PDF and ePub downloads, according to the available data) and Abstracts Views on Vision4Press platform.
Data correspond to usage on the plateform after 2015. The current usage metrics is available 48-96 hours after online publication and is updated daily on week days.
Initial download of the metrics may take a while.