Fig. 2.
Download original image
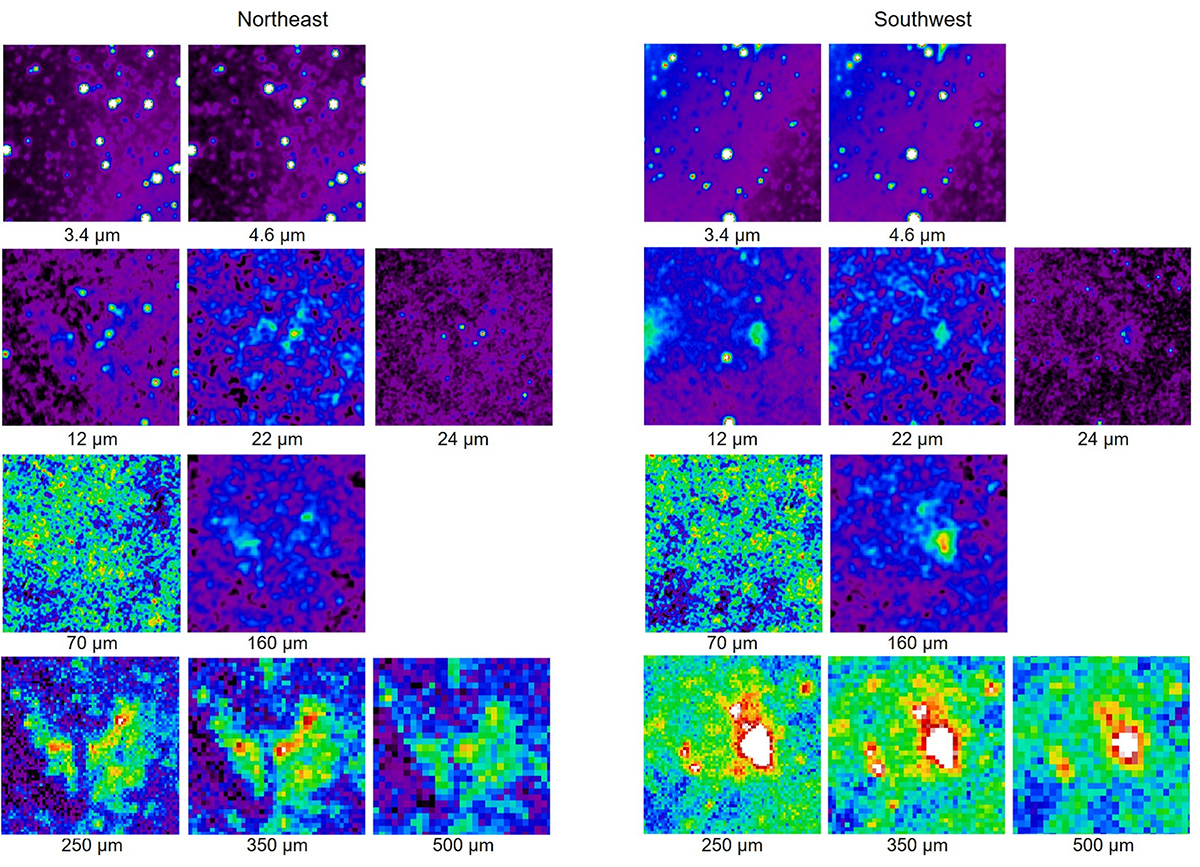
Near- to far-IR images in the northeast (left) and the southwest (right) region of Centaurus A, whose sizes are 400″ × 400″ as denoted by the yellow squares in Fig. 1. For each panel, from top left to bottom right: WISE 3.4, 4.6, 12, and 22 μm, Spitzer 24 μm, Herschel/PACS 70 and 160 μm, Herschel/SPIRE 250, 350, and 500 μm images. The 24, 70, and 160 μm images are smoothed with Gaussian kernels of ![]() ,
, ![]() , and
, and ![]() , respectively. The image color scale of each band is linearly drawn and the same for the northeast and the southwest region. The color bar range of each image is set to 97% of the pixel value distribution.
, respectively. The image color scale of each band is linearly drawn and the same for the northeast and the southwest region. The color bar range of each image is set to 97% of the pixel value distribution.
Current usage metrics show cumulative count of Article Views (full-text article views including HTML views, PDF and ePub downloads, according to the available data) and Abstracts Views on Vision4Press platform.
Data correspond to usage on the plateform after 2015. The current usage metrics is available 48-96 hours after online publication and is updated daily on week days.
Initial download of the metrics may take a while.