Fig. 1.
Download original image
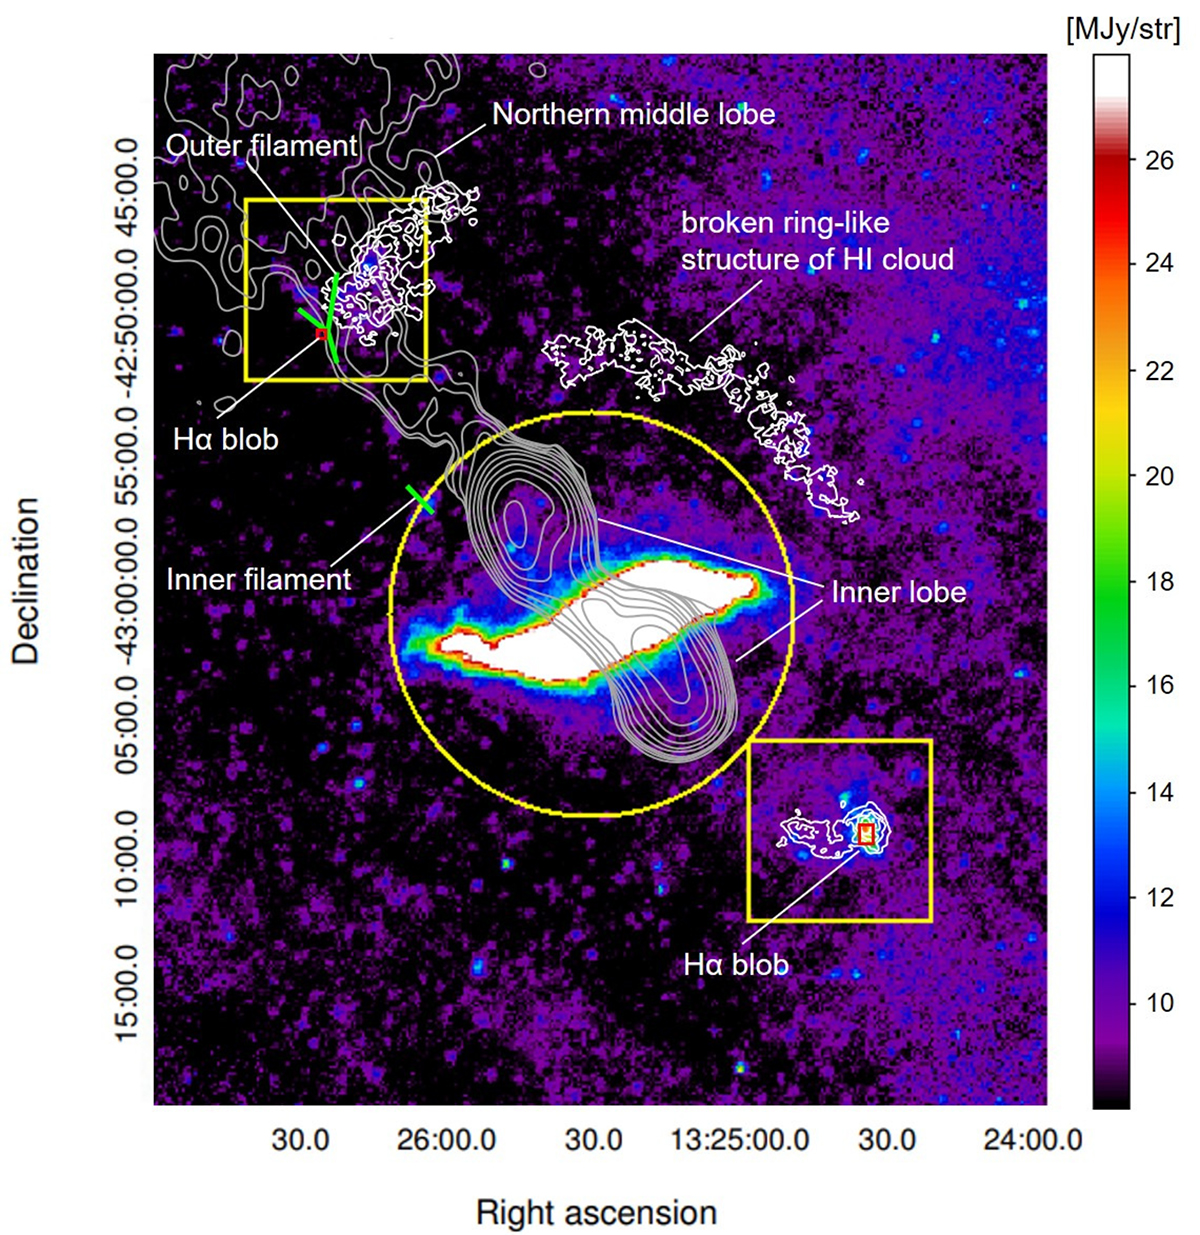
Overview of Cen A and the relevant structure. The background color image is taken from the Herschel 250 μm map. The gray and the white contours show the radio jet structure of Cen A, which is obtained with the Australia Telescope Compact Array (ATCA) at 1.4 GHz (Morganti et al. 1999) and the H I column density in the halo (Auld et al. 2012), respectively. The red squares in the northeast and southwest halos indicate the regions where the Hα emission was detected by Santoro et al. (2016) and Keel et al. (2019), respectively. The yellow squares denote the boundaries of the northeast and the southwest region defined in the present study (e.g., Figs. 2 and 4). The yellow circle corresponds to the aperture region for the SED fitting described in Section 4.2.
Current usage metrics show cumulative count of Article Views (full-text article views including HTML views, PDF and ePub downloads, according to the available data) and Abstracts Views on Vision4Press platform.
Data correspond to usage on the plateform after 2015. The current usage metrics is available 48-96 hours after online publication and is updated daily on week days.
Initial download of the metrics may take a while.