Fig. 8.
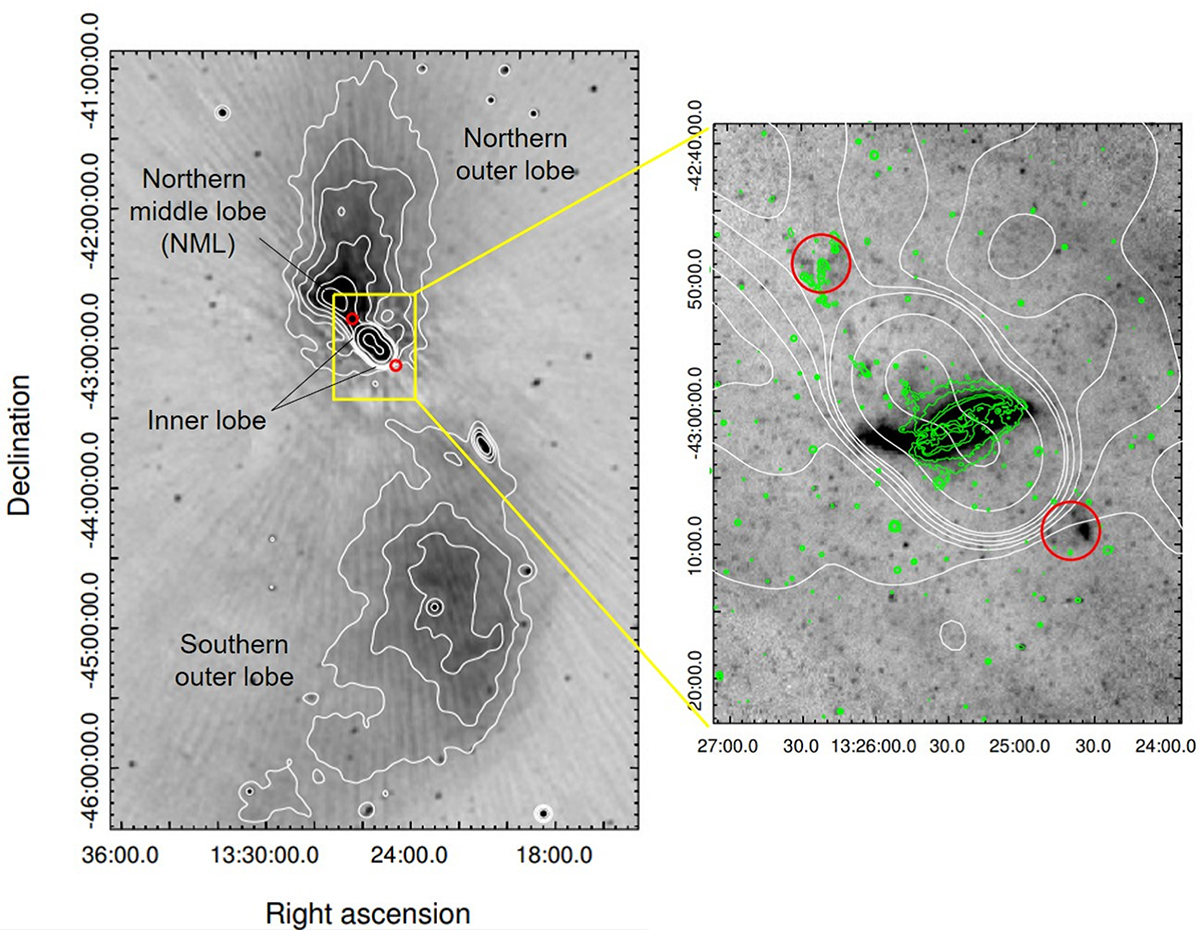
Download original image
Radio jet structure in the halo of Cen A. Left: The background image is the MWA 200 MHz map. The contours correspond to the levels of 0.3, 0.5, 0.7, 1.0, 1.5, 2, 10, and 50 Jy/beam. The red circles correspond to the aperture region for the SED fitting in our study. Right: The background image is the Herschel 250 μm map. The green and the white contours show the GALEX/FUV map (as shown in Fig. 3) and the radio jet structure of Cen A as shown in the left panel, respectively. The red circles are the same with those in the left panel.
Current usage metrics show cumulative count of Article Views (full-text article views including HTML views, PDF and ePub downloads, according to the available data) and Abstracts Views on Vision4Press platform.
Data correspond to usage on the plateform after 2015. The current usage metrics is available 48-96 hours after online publication and is updated daily on week days.
Initial download of the metrics may take a while.