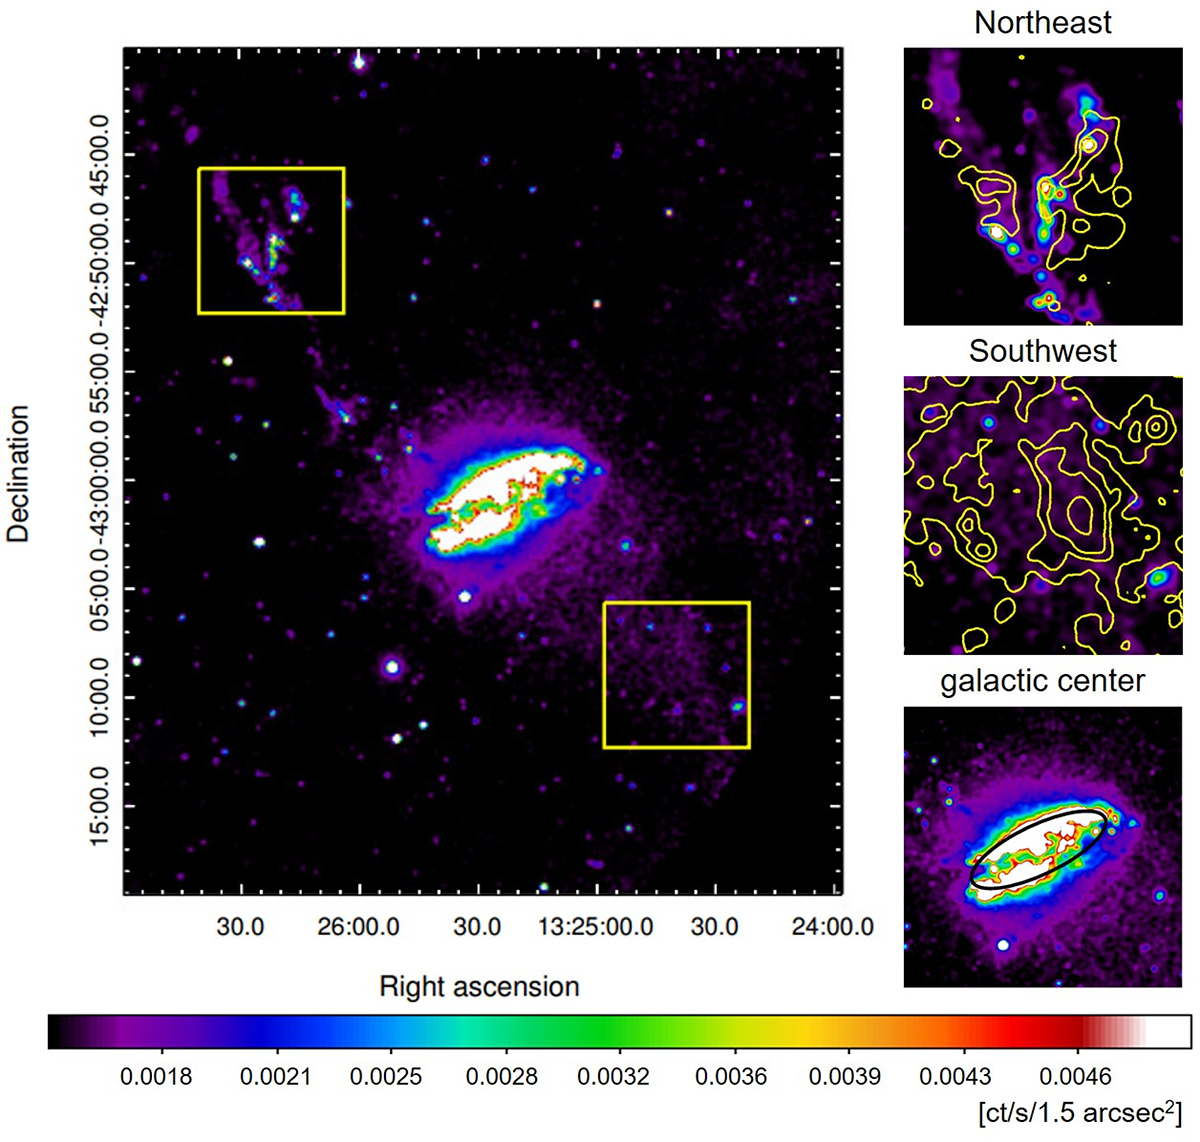
Fig. 4.
Download original image
The GALEX/FUV maps of Centaurus A. Left: The overall map of Centaurus A. Yellow squares correspond to the northeast and the southwest region investigated in this paper, as in Fig. 2, for both of which past studies suggest that jet-induced star formation may have occurred therein. Right: Enlarged FUV maps of the northeast (top), the southwest (center), and the central (bottom) region. The yellow contours show the Herschel 250 μm intensity distribution, the levels of which correspond to 9, 10.5, 12, and 18 MJy sr−1. The black ellipse in the bottom panel is the photometry aperture to measure the FUV flux from the central region of Cen A. All the FUV images in the left and right panels are shown after smoothed with a Gaussian kernel of ![]() .
.
Current usage metrics show cumulative count of Article Views (full-text article views including HTML views, PDF and ePub downloads, according to the available data) and Abstracts Views on Vision4Press platform.
Data correspond to usage on the plateform after 2015. The current usage metrics is available 48-96 hours after online publication and is updated daily on week days.
Initial download of the metrics may take a while.