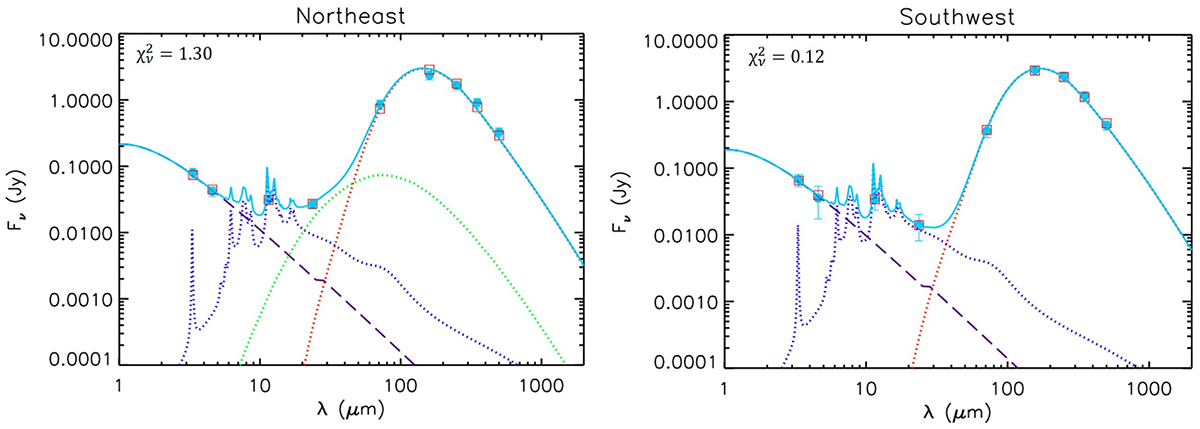
Fig. 5.
Download original image
Results of the SED fitting for the northeast and the southwest region of the halo of Cen A. A purple dashed line shows the stellar continuum, while purple, green, and red dotted lines show the continua emitted by the PAH, small dust, and large dust components, respectively (see text for their definitions). Blue circles and red squares represent the fluxes observed in each band and predicted by the model SED, respectively.
Current usage metrics show cumulative count of Article Views (full-text article views including HTML views, PDF and ePub downloads, according to the available data) and Abstracts Views on Vision4Press platform.
Data correspond to usage on the plateform after 2015. The current usage metrics is available 48-96 hours after online publication and is updated daily on week days.
Initial download of the metrics may take a while.