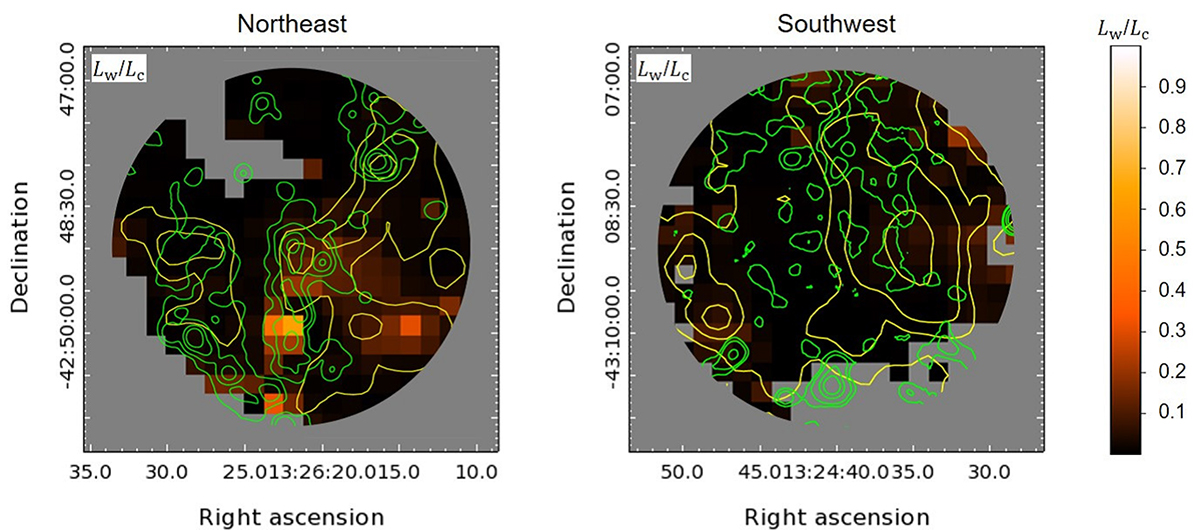
Fig. 6.
Download original image
Warm and cold dust luminosity ratio maps for (left) the northeast and (right) the southwest region in the halo of Cen A. The green contours show the GALEX/FUV intensity distribution, where the contours correspond to the levels of 0.00155, 0.002, 0.0035, and 0.006 ct s−1 per 1.5 arcsec2 and 0.0015, 0.00155, 0.0017, and 0.00185 ct s−1 per 1.5 arcsec2 for the northeast and the southwest region, respectively. The yellow contours show the Herschel 250 μm intensity distribution, where the contours correspond to the levels of 9, 10.5, 12, and 18 MJy sr−1.
Current usage metrics show cumulative count of Article Views (full-text article views including HTML views, PDF and ePub downloads, according to the available data) and Abstracts Views on Vision4Press platform.
Data correspond to usage on the plateform after 2015. The current usage metrics is available 48-96 hours after online publication and is updated daily on week days.
Initial download of the metrics may take a while.