| Issue |
A&A
Volume 690, October 2024
|
|
|---|---|---|
| Article Number | A286 | |
| Number of page(s) | 14 | |
| Section | Extragalactic astronomy | |
| DOI | https://doi.org/10.1051/0004-6361/202449439 | |
| Published online | 17 October 2024 | |
The role of active galactic nucleus feedback on the evolution of dwarf galaxies from cosmological simulations
Supermassive black holes suppress star formation in low-mass galaxies
1
Instituto de Astrofísica de Canarias, Calle Via Láctea s/n, 38206 La Laguna, Tenerife, Spain
2
Universidad de La Laguna, Avda. Astrofísico Fco. Sánchez, 38205 La Laguna, Tenerife, Spain
3
Astrophysics Research Institute, Liverpool John Moores University, 146 Brownlow Hill, Liverpool L3 5RF, UK
Received:
31
January
2024
Accepted:
3
July
2024
Aims. Recent observational studies suggest that feedback from active galactic nuclei (AGNs) may play an important role in the formation and evolution of dwarf galaxies, an issue that has received little attention from a theoretical perspective.
Methods. We investigated this using two sets of 12 cosmological magnetohydrodynamic simulations of the formation of dwarf galaxies (108.3M⊙ ≤ M* ≤ 109.8M⊙): one set using a version of the AURIGA galaxy formation physics model including AGN feedback and a parallel set with AGN feedback turned off.
Results. We show that the full-physics AGN runs satisfactorily reproduce several scaling relations, including the black-hole-to-stellar mass (MBH-M⋆), the black-hole-to-sigma (MBH-σ⋆), and the baryonic Tully-Fisher relation. We find that the global star formation (SF) of galaxies run with an AGN is reduced compared to the one in which the AGN has been turned off, suggesting that AGN feedback is a viable way of suppressing SF in dwarf galaxies, even though none of our galaxies is completely quenched by z = 0. Furthermore, we find a tight correlation between the median SF rates and the MBH/M⋆ ratio in our simulated dwarfs. Star formation is suppressed due to gas heating in the vicinity of the AGN: less HI gas is available in AGN runs, though the total amount of gas is preserved across the two settings within each galaxy. This indicates that the main effect of AGN feedback in our dwarfs is to heat up and push the gas away from the galaxy’s centre rather than expelling it completely. Finally, we show that the two galaxies harbouring the largest supermassive black holes have suffered a considerable (up to ∼65%) reduction in their central dark matter density, pinpointing the role of AGNs in determining the final dark matter mass distribution within dwarf galaxies. This pilot paper highlights the importance of modelling AGN feedback at the lowest mass scales and the impact this can have on dwarf galaxy evolution.
Key words: galaxies: active / galaxies: dwarf / galaxies: evolution / galaxies: formation / galaxies: nuclei / galaxies: star formation
© The Authors 2024
 Open Access article, published by EDP Sciences, under the terms of the Creative Commons Attribution License (https://creativecommons.org/licenses/by/4.0), which permits unrestricted use, distribution, and reproduction in any medium, provided the original work is properly cited.
This article is published in open access under the Subscribe to Open model. Subscribe to A&A to support open access publication.
1. Introduction
The Λ cold dark matter (ΛCDM) model of cosmology is the prevailing theoretical framework for cosmological structure formation, including the distribution and demographics of galaxies (Davis et al. 1985). In this cosmology, dark matter (DM) haloes collapse from initial primordial density fluctuations. These haloes then proceed to merge with one another to build larger haloes with sufficient gravity to provoke the collapse and cooling of gas, which produces stars, thereby populating DM haloes with luminous galaxies. This is the intersection of cosmology and galaxy formation, where key tests lie in understanding the relation between galaxies and DM haloes.
Abundance matching tells us that galaxy formation is most efficient for L* galaxies (with halo masses of around ∼ 1012 M⊙) and less efficient towards the high-mass and low-mass ends of the galaxy stellar mass function (e.g. Guo et al. 2010; Moster et al. 2013). The most widely accepted explanations of these trends invoke some baryonic process. For massive galaxies, energetic feedback from active galactic nuclei (AGNs) is critical in regulating star formation (SF) (Binney & Tabor 1995; Ferrarese & Merritt 2000; Di Matteo et al. 2005; Springel et al. 2005, e.g.) by heating the interstellar gas and driving galactic winds. Indeed, several numerical simulations have shown that AGN feedback could quench massive galaxies and bring their properties in agreement with observations (e.g. Springel 2010; Dubois et al. 2014; Vogelsberger et al. 2014; Schaye et al. 2015; Weinberger et al. 2017; Henden et al. 2018).
At the low-mass end, re-ionisation (e.g. Somerville 2002; Okamoto et al. 2008; Pawlik & Schaye 2009) and supernova (SN) feedback (e.g. Larson 1974; Dekel & Silk 1986; White & Frenk 1991) are thought to play a key role in suppressing SF in such small, dwarf galaxies. However, even considering these feedback processes, observations of dwarf galaxies, particularly within the Local Group, still challenge the ΛCDM paradigm. Recent examples include: the missing satellite problem, (e.g. Kauffmann et al. 1993; Klypin et al. 1999; Moore et al. 1999; Bullock 2010); the ‘too-big-to-fail’ problem (e.g. Read et al. 2006; Boylan-Kolchin et al. 2012; Garrison-Kimmel et al. 2014); the ‘cusp-core’ problem (e.g. Flores & Primack 1994; Moore 1994; de Blok 2010); and the diversity of rotation curve problems (e.g. Oman et al. 2015; Santos-Santos et al. 2018, 2020).
It has been claimed in the literature that some of these problems can be solved by the inclusion of properly modelled baryonic physics in simulations, such as the missing satellites problem, that can be explained by feedback processes reducing the efficiency of dwarf galaxy formation (e.g. Sawala et al. 2016) or resolving the spatial scale corresponding to half-light radii of the dwarfs (Engler et al. 2021; Wetzel et al. 2016). Another example is the cusp-core problem, which can likewise be alleviated if SN-driven outflows flatten the central DM cusps of simulated dwarfs (Governato et al. 2010; Pontzen & Governato 2012; Di Cintio et al. 2014; Brook & Di Cintio 2015). Nevertheless, a comprehensive, self-consistent solution to all of these dwarf galaxy problems remains elusive (see Sales et al. 2022, for a discussion on the historical and new tensions of the ΛCDM model). Furthermore, the recent studies of Müller et al. (2024) and Homma et al. (2024) have reported larger numbers of satellites around Milky Way-mass galaxies compared to some simulation predictions – contrary to the aforementioned missing satellites problem. However, whether these discrepancies are attributed to deficits in current cosmological models or baryonic physics models is unclear.
An attractive avenue, suggested by recent theoretical works (Silk 2017; Dashyan et al. 2018), is to consider the role and influence of AGN feedback in low-mass galaxies, which might provide a unifying scheme to explain most of the above-mentioned problems. In particular, Silk (2017) postulates that massive black holes (BHs) could be ubiquitously present in all early-forming dwarfs, having been active in their gas-rich pasts, but being mostly passive today. One question is whether AGN feedback could play an important role in the evolution of dwarf galaxies, as well as massive ones. Over the past few years, mounting observational evidence pointed to the fact that the number of dwarf galaxies hosting AGNs could be larger than previously thought (see Reines (2022) for a recent review on the topic).
Several observational techniques have been employed to look for AGN signatures in dwarf galaxies, finding a non-negligible occupation fraction (OF) in most cases: these studies include detections based on optical Hα emission lines (e.g. Greene & Ho 2004, 2007; Reines et al. 2013; Chilingarian et al. 2018) and X-ray observations (e.g. Reines et al. 2013; Baldassare et al. 2015, 2017). Furthermore, observations using integral field unit (IFU) spectroscopic surveys, such as MANGA/SDSS (Bundy et al. 2015), have identified several ‘hidden’ AGN in dwarfs (e.g. Mezcua et al. 2016; Penny et al. 2018; Mezcua & Domínguez Sánchez 2020, 2024). Recently, a systematic study of AGNs at low-masses using IFU data has been explored by Mezcua & Domínguez Sánchez (2024).
The discovery of AGNs in dwarf galaxies has motivated, in recent years, the study of the impact of central supermassive black holes (SMBHs) on the host dwarf galaxies by using hydrodynamic simulations. Large-scale simulations are useful to explore the AGNs’ OFs at low-mass scales. However, the current literature on the subject is characterised by significant variations in findings: while some simulations such as ROMULUS and IllustrisTNG overproduce bright AGNs (Sharma et al. 2020; Haidar et al. 2022), others such as EAGLE, Illustris, or FABLE underproduce bright AGNs (e.g. Koudmani et al. 2021; Haidar et al. 2022). Indeed, the use of different feedback schemes can produce significant discrepancies between simulations (Habouzit et al. 2017). Table A.1 provides a comparative summary of properties from our simulation suite and those from other studies in the literature. Several studies have shown how strong SN feedback could even hinder BH growth by preventing the accretion of gas (e.g. Dubois et al. 2015; Bower et al. 2017; Anglés-Alcázar et al. 2017; Trebitsch et al. 2018; Truong et al. 2021; Koudmani et al. 2022). In those cases in which BHs are instead able to grow and accrete gas, the related AGNs can generate outflows that can play a determinant role in regulating SF in dwarf galaxies (e.g. Koudmani et al. 2019; Barai & de Gouveia Dal Pino 2019; Bellovary et al. 2019; Sharma et al. 2020; Koudmani et al. 2021, 2022). Nevertheless, the degree to which AGN feedback is able to suppress SF in the early gas-rich phase of the dwarf galaxy evolution, as has been suggested by Silk (2017), is still an open question: the field has now reached a stage at which a comprehensive investigation of this issue is not only warranted but also needed.
In this paper, we use zoom-in simulations of dwarf galaxies to study the impact of AGN feedback on galaxy evolution at the low-mass end, by running exactly the same cosmological initial conditions of dwarfs with and without the inclusion of AGNs. In Section 2.1, we briefly describe the modified AURIGA simulations used in this work. The BH seeding and AGN feedback modelling are described in Section 2.2. The properties of the galaxy sample are explained in Section 2.3. In Section 3, we present scaling relations relative to our sample hosting AGNs (Section 3.1) as well as the impact of AGNs on global properties of simulated galaxies, such as the stellar-to-halo mass relation (Section 3.2), the Baryonic Tully-Fisher relation (Section 3.3), and the dependence on the SF history (SFH) (Section 3.4). The DM profiles’ dependence on AGNs is described in Section 3.6. We touch upon gas properties and how they are affected by the inclusion of AGNs in Section 3.7, a thorough investigation of which we defer to a future dedicated study. We discuss our results in Section 4.
2. Cosmological magnetohydrodynamic dwarf galaxy simulations
2.1. Simulation code and physics model
The simulations in this study were performed with the massively parallel N-body, second-order accurate magnetohydrodynamic (MHD) code AREPO (Springel 2010; Pakmor et al. 2016). AREPO calculates gravitational forces using a TreePM method, which incorporates a fast Fourier transform for long-range forces and a hierarchical oct-tree algorithm for short-range forces. The code utilises a dynamic, unstructured mesh constructed through Voronoi tessellation, allowing for the finite-volume discretisation of the MHD equations.
The simulations include a version of the AURIGA physics model, which includes: primordial and metal line cooling; a uniform UV background that completes re-ionisation at z = 6; the (Springel & Hernquist 2003) subgrid model for SF; magnetic fields seeded at initial conditions with a uniform distribution in a random orientation (Pakmor et al. 2017); and energetic feedback from AGN and type II SNe (SNe II). Each star particle represents a single stellar population characterised by mass, metallicity, and age. Mass loss and chemical enrichment are modelled from stellar evolutionary processes; specifically, type Ia supernovae (SNe Ia), asymptotic giant branch (AGB) stars, and SNe II. The AURIGA physics model is fully described in Grand et al. (2017). A detailed description of the differences between AURIGA and IllustrisTNG can be found in Section 2.3.1 of Grand et al. (2024).
To model galactic winds driven by SNe II, wind particles are launched with a velocity that scales with the local, one-dimensional DM velocity dispersion, σDM. Unlike the AURIGA model, we set an imposed minimum wind velocity of vw,min = 350 km s−1 following (Pillepich et al. 2018), instead of the default value of vw,min = 0 km s−1 used in the original AURIGA physics model. The non-zero minimum wind velocity that we use in this paper has the effect of reducing the wind mass loading factor and the total stellar mass for haloes with masses ≤1011 M⊙ compared to the original AURIGA physics model. As is discussed in Section 3.2, this shifts the galaxies onto or just below the stellar-mass-halo-mass relation, compared to the original case of no minimum wind velocity in which the galaxies lie slightly above it.
2.2. Black hole seeding, accretion, and feedback
The BHs were seeded with a mass of  in halo friend-of-friend (FOF) groups of masses greater than
  and were placed at the position of the densest gas cell. The BH particles act as sinks that draw in mass from the nearest neighbouring gas cells (Springel 2005). The rate of accretion follows the Eddington-limited Bondi–Hoyle–Lyttleton accretion formula (Bondi & Hoyle 1944; Bondi 1952) in addition to a term that models the radio mode accretion, given by
![$$ \begin{aligned} {M}_{\mathrm{BH} } = \mathrm{min} \left[\frac{4\pi G^2 M^2_{\mathrm{BH} } \rho }{\left( c_s^2 + v^2_{\mathrm{BH} }\right)^{3/2}} + \frac{R(T,z)L_{\mathrm{X} }}{\epsilon _\mathrm{f} \epsilon _\mathrm{r} c^2}, {M}_{\mathrm{Edd} }\right] , \end{aligned} $$](/articles/aa/full_html/2024/10/aa49439-24/aa49439-24-eq4.gif)
where ρ and cs are the density and sound speed of the surrounding gas, vBH is the velocity of the BH relative to the gas, ̇MEdd is the Eddington accretion rate, LX is calculated from the thermal state and cooling time of the non-star-forming gas cells, and R(T, z) is a scaling factor calculated from relations presented in Nulsen & Fabian (2000). We defined the BH radiative efficiency parameter as ϵr = 0.2 and the fraction of released energy that couples thermally to the gas as ϵf = 0.07.
Energy from AGN quasar mode feedback was injected continuously, following the same criteria as in Weinberger et al. (2017). The radio mode term comes from the assumption that the hot halo gas is in thermodynamic equilibrium so that X-ray losses are compensated for by thermal energy injection via the gentle inflation of multiple bubbles within the virial radius of the halo (see, Grand et al. 2017). However, this mode of AGN feedback is important for more massive haloes like Milky Way-mass spiral galaxies and giant ellipticals; by construction, the AGN is always in quasar mode for each of our simulations. Therefore, BH feedback is in practice that of the quasar mode, which is modelled via isotropic thermal energy injection into neighbouring gas cells, where the total energy to be injected is given by
where c is the speed of light. The thermal energy is injected into neighbouring gas cells with the amount of energy per cell following an inverse square relation. The additional radiative feedback adds to the UV background locally (see Vogelsberger et al. 2013 for more details).
2.3. Initial conditions
Our simulated haloes were selected from the DM-only counterpart of the EAGLE simulation, in a co-moving box with a side length of 67.77 (L100N1504), as was introduced in Schaye et al. (2015). We selected 12 isolated haloes with a z = 0 mass between 5 × 10¹⁰ M⊙ and 5×10¹¹ M⊙ using the same isolation criterion described in Grand et al. (2017)1. We then re-simulated these haloes using the zoom-in technique, adopting the cosmological parameters given in Planck Collaboration XVI (2014): Ωm = 0.307, Ωb = 0.048, ΩΛ = 0.693, σ8 = 0.8288, and a Hubble constant of
  , where h = 0.6777. The typical mass resolution contained in each Lagrangian volume for gas and DM particles is
  and
and 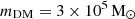 , respectively. The co-moving softening length of collisionless particles was set to 500 h−1 cpc; the physical softening length was kept fixed to 250 h−1 pc below z = 1.
Haloes and subhalos were identified using the Amiga Halo Finder, AHF (Knollmann & Knebe 2009), in which halo virial masses, M200, are defined as the masses contained within a sphere of virial radius R200, enclosing Δ200 ≃ 200 times the critical density of the Universe at z = 0. Subhalos were considered resolved if they had at least 200 particles. The central halo is the one found at the minimum gravitational potential of the group. All other subhalos in the same group are categorised as satellites of the central one. In this work, only the central halo has been considered, in order to focus on the internal processes of the galaxy, rather than on environmental ones. The bulk of the analysis was done using a modified version of PYNBODY (Pontzen et al. 2013) that is compatible with AURIGA.
We performed two sets of simulations: the first one uses the physics model described in Section 2.1. We hereafter refer to this configuration as the ‘fiducial’ or ‘AGN’ run. In the second configuration, we ran exactly the same galaxies but without the inclusion of BHs and related AGN feedback. We refer to this configuration as the ‘non-AGN’ run. Table 1 summarises the final halo, stellar, and BH masses, as well as the halo virial radius, for our simulated galaxies run with and without the inclusion of AGNs.
z = 0 properties of simulated dwarf galaxies run with and without the inclusion of AGNs.
3. Results
Our work aims to understand the impact of AGN feedback on the properties of intermediate-mass dwarf galaxies by analysing and comparing our fiducial simulation set with the non-AGN runs. In this section, we present scaling relations directly connected to the presence of a central SMBH in the fiducial run, before studying how AGNs affect various galaxy properties.
3.1. The MBH-M⋆ and MBH-σ⋆ relations
In Fig. 1, we examine the correlation between the mass of the central SMBH and the stellar mass of the host galaxy, at z = 0. We find that our simulations follow the positive trends obtained in observations reported in Schramm & Silverman (2013) (dark line) as well as in Greene et al. (2020) for early-type galaxies (dotted orange line): galaxies with progressively smaller stellar masses host less and less massive SMBHs at their centre, all the way down to the smallest scales simulated here. Our simulations fall nicely within the scatter of the Schramm & Silverman (2013) relation. We further show the same scaling relations obtained by Reines & Volonteri (2015), in cyan, who used a sample of broad-line AGNs in the nearby universe, constructed mainly using SDSS spectroscopy, looking for Seyfert-like narrow-line ratios and broad Hα emission.
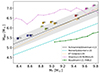 |
Fig. 1. BH mass-stellar mass relation for the 12 AURIGA dwarf galaxies run with the fiducial configuration. Each galaxy is shown in a different colour to facilitate comparisons with the figures in the following sections. The solid black line shows the median relation given by Schramm & Silverman (2013), with the dashed line indicating the range below which such a relation is extrapolated and the shaded area showing a 0.2 dex scatter. The dashed cyan line shows the relation of Reines & Volonteri (2015), while the dotted orange line indicates the same relation for Greene et al. (2020) early-type galaxies. For a comparison with ongoing simulation results, we show in green the mean MBH-M⋆ relation from the FABLE simulations suite (Koudmani et al. 2021) and in purple that from the ROMULUS simulation (Sharma et al. 2020). |
To compare with recent theoretical works, we additionally show the mean MBH-M⋆ relation from the FABLE simulations (Koudmani et al. 2021, green line), which also use the AREPO code but with a different galaxy formation model from AURIGA, and from the ROMULUS25 simulations (Sharma et al. 2020, purple line) which employ the code ChaNGa (Menon et al. 2015) with baryonic prescriptions from Gasoline2 (Stinson et al. 2006; Shen et al. 2010; Wadsley et al. 2017). Interestingly, across the galaxy stellar mass range explored, the FABLE simulations produce a population of BHs that are under-massive compared to both our simulation results and to currently observed relations. In contrast, the ROMULUS25 suite produces over-massive BHs that deviate from the MBH-M⋆ relation at small scales. This highlights the strong dependence of the final BH mass-stellar mass relation on the BH seeding mass and accretion model employed in each case, the former being 105 M⊙ and 106 M⊙ for the FABLE and ROMULUS25 simulations, respectively.
In Fig. 2, we show the relation between SMBH mass and the central velocity dispersion of the host galaxy’s stellar component, and compare our simulation results with observational works that explored the low-mass end of such an MBH-σ⋆ relation. While this relation has been studied in detail in the high-mass regime, only in recent years has this been extended to the low-mass range. To measure the velocity dispersion quantity, we defined σ⋆ as the median SPH-smoothed local velocity dispersion of each stellar particle enclosed within half of the effective radius, Reff. Our sample follows reasonably well the trend derived in Xiao et al. (2011) (grey points) and later on in Baldassare et al. (2020) (black crosses) within the observed scatter (grey-shaded area). Furthermore, we have compared it with the relation obtained in Martín-Navarro & Mezcua (2018) for low-mass Seyfert 1 galaxies, in which they computed the MBH following the same assumption of Baldassare et al. (2020) and Xiao et al. (2011) that the gas is virialised, using the luminosity and the full width at half maximum of the broad Hα component (see Eq. (1) from Martín-Navarro & Mezcua 2018 and Eq. (6) from Xiao et al. 2011). The agreement between our samples and the observed MBH-M⋆ and MBH-σ⋆ scaling relations make our simulation suite the ideal starting point from which to explore the impact of AGN feedback on dwarf galaxies. In the next sections, we study the stellar-to-halo mass relation, the baryonic Tully-Fisher relation (BTFR), and the star formation histories (SFHs) of our simulated dwarfs with and without the inclusion of AGN feedback, and compare these two settings with observational data.
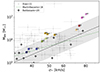 |
Fig. 2. BH mass versus stellar velocity dispersion (σ⋆) relation for our simulated dwarfs, which are indicated as coloured squares. The velocity dispersion of the stellar component has been measured inside 0.5 Reff for each galaxy. Observations from Xiao et al. (2011) are marked by grey points with error bars, with a 0.2 dex scatter as a grey-shaded area. Observations from Baldassare et al. (2020) are marked by black crosses. The green line shows the Martín-Navarro & Mezcua (2018) observational relation obtained for low-mass Seyfert 1 galaxies. All of our simulated galaxies follow fairly well current existing observational relations between the mass of the central SMBH and the velocity dispersion of the galaxy’s stellar component. |
3.2. The stellar-to-halo mass relation
The relation between the stellar and virial mass of simulated dwarfs in the fiducial and non-AGN configurations can be seen in Fig. 3. Squares represent individual galaxies in the fiducial run, colour-coded according to their central SMBH mass. Fiducial simulations are linked to their non-AGN galaxy counterparts, denoted by black dots. This image shows that galaxies in both configurations agree fairly well with M⋆-M200 measurements given from the abundance matching relation (AM) (Guo et al. 2010; Moster et al. 2013; Girelli et al. 2020) within the allowed scatter. However, it can be noticed that those galaxies harbouring a central SMBH of a mass larger than ∼ 106 M⊙ have a strongly reduced total stellar mass compared to their non-AGN counterpart. This suggests that AGNs have a non-negligible impact on the global SFH of dwarf galaxies, being able to reduce the stellar mass of our simulated galaxies by as much as a factor of two (see for example galaxy H4 in Table 1). On the contrary, the impact of AGN feedback is negligible (though still present) for those galaxies hosting an SMBH less massive than ∼ 106 M⊙, which is typically found in galaxies with stellar masses M⋆ ≤ 108.8 M⊙.
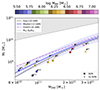 |
Fig. 3. Stellar-to-halo mass relation of simulated dwarf galaxies: black points represent galaxies run without BHs and AGN feedback, while coloured squares represent those galaxies run in the fiducial model, i.e., including a central SMBH. In this case, each galaxy is shown with a different colour reflecting the mass of its central SMBH. Each fiducial or non-AGN pair (i.e., a simulation with the exact same initial conditions) is connected with a line. In solid blue, the abundance matching relations from Moster et al. (2013) are shown with a scatter of 0.2 dex as a shaded blue region. Estimates of Guo et al. (2010) and Girelli et al. (2020) are shown with dashed dark and dash-dotted purple lines, respectively. Galaxies harbouring SMBHs more massive than ∼ 106 M⊙ have a strongly reduced M⋆ compared to their non-AGN counterparts. |
3.3. The Baryonic Tully-Fisher relation
To infer whether our simulated galaxies represent a trustworthy sample, we studied in detail their BTFR; in other words, the relationship between the rotation velocity of galaxies, as measured by their HI line, and their baryonic mass content (McGaugh 2012). As neutral atomic gas dominates the gas component in disk galaxies, in this analysis we defined the baryonic mass of a galaxy as the sum of the neutral hydrogen plus the stellar mass – that is, Mb= M⋆+ MHI – in line with observations. While the slope of the BTFR is well constrained at high masses, it suffers from several observational uncertainties at lower, dwarf-mass scales. Historically, the velocity of the galaxies was measured at the radius at which the rotation curve reaches its flat part, Vflat (Stark et al. 2009). However, for dwarf galaxies especially, this point is often not reached at the outermost measured radius. Brook et al. (2016), using simulations, highlight how the slope of the BTFR changes at low masses when measuring the rotation velocity of the galaxy at different positions, such as at Vflat, or at the extent of the HI gas disk, Vlast, or using the width of the HI line profiles.
Keeping this in mind, here we have used three different definitions to measure the rotation velocity of our simulated dwarfs, and compared them with BTFRs presented in the literature:
-
VDM,max: the maximum circular velocity of the DM halo of each galaxy;
-
Vflat: the circular velocity at the flat part of the rotation curve, as was done in McGaugh (2012) for observed late-type galaxies;
-
V8h: the rotation velocity at eight times the disk radii, Rdisc, such that Reff = 1.678 × Rdisc, the radius at which most of the baryonic mass is found, as was done in Di Cintio & Lelli (2016) using semi-analytic models.
We measured the amount of neutral atomic hydrogen in the simulations, following the phenomenological method described in Marinacci et al. (2017) and based on Leroy et al. (2008). This method consists of fitting the ratio between the column density of molecular over atomic hydrogen with a functional form depending on the gas mid-plane pressure, in order to then compute the atomic HI fraction. We followed such an empirical approach since the galaxy formation modules currently employed in AURIGA do not account for the mechanisms responsible for the creation and destruction of molecular hydrogen.
In Fig. 4, we show the BTFR derived for our set of simulated galaxies using the three definitions of velocity as above: each symbol indicates a particular way of measuring Vrot, while each colour represents a specific galaxy, following the same colour scheme as in Fig. 3, based on the mass of the central SMBH. The left panel refers to the fiducial, AGN model, while the right panel refers to the same simulations run without the inclusion of BHs and AGN feedback. Comparing both configurations with observed (McGaugh 2012) and semi-analytic (Di Cintio & Lelli 2016) BTFRs, we note that the inclusion of AGN feedback brings most of the galaxies in line with expectations, especially the most massive ones in our sample. This is because the total HI gas + stellar mass decreases in the AGN configuration. This suggests that, although the presence of a central SMBH does not seem to be essential to reproduce the M⋆-M200 relation, it is important in order to correctly match the total baryonic mass of galaxies versus their rotational velocity. Dwarf galaxies run without the inclusion of AGN feedback are consistently above such a relation, indicating that they retain too much baryonic material compared to observational data.
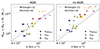 |
Fig. 4. Baryonic Tully-Fisher relation of simulated dwarf galaxies, run with (left panel) and without (right panel) the inclusion of BH and AGN feedback. Each galaxy’s baryonic mass is measured within the virial radius and shown in a different colour according to its z = 0 BH mass, as in Fig. 3. Different symbols indicate different ways of measuring the rotational velocity, Vrot: VDM, max, Vflat, and V8h are shown as squares, triangles, and diamonds, respectively. The observational relations given by McGaugh (2012), are depicted with the solid line, and the relation obtained in Di Cintio & Lelli (2016) using semi-analytic models with the dotted line. Simulated galaxies that include AGN feedback are in better agreement with the observed BTFR. |
3.4. Star formation histories
We now proceed to examine how AGN feedback affects the SFH of our set of 12 simulated dwarf galaxies. Fig. 5 shows the SF as a function of time, taking into account all the star particles within the virial radius of each halo (shaded histograms) or by including only those stars within 5 kpc of the galaxy centre (solid line histograms). In both cases, the stars were identified at z = 0 and the corresponding ages were used to derive a SFH. Galaxies are ordered by the mass of their central SMBH: the top left panel shows the SFH of the dwarfs that host the most massive SMBH, whereas the bottom right panel shows the smallest one. In each panel, the logarithm of the SMBH accretion rate through time is plotted as a solid black line (with rates given on the right-hand axis) as a direct indication of the AGN feedback at different epochs. The SFHs of galaxies run with AGNs are shown in blue, while those without AGNs are in green.
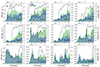 |
Fig. 5. SFHs of simulated dwarf galaxies, within the virial radius (shaded histograms) and within 5 kpc of the centre (open histograms). Galaxies that evolved with AGN feedback are represented in blue, while those without AGNs are shown in green, and they are ordered according to their z = 0 BH mass (the most massive SMBH hosted in Halo 0, top left, the least massive one in Halo 11, bottom right). The logarithm of the SMBH accretion rate through time is indicated on the right-hand Y axis in each panel and is shown as a black line. |
Fig. 5 shows a consistent trend in which the SF of the dwarfs including AGNs decreases relative to their non-AGN counterpart, once the central SMBH is seeded and starts accreting mass. The total amount of suppression in SF appears to scale with the SMBH accretion rate and with the duration of the epoch in which significant accretion occurs. Thus, the suppression is more evident for the most massive galaxies (at z = 0) that seed their SMBHs relatively early, such as H0 (top-left panel of Fig. 5). In contrast, the SFH of the simulated dwarf with the smallest SMBH (lower-right panel of Fig. 5) is almost the same in each configuration until the last ∼1 Gyr of evolution, when the SMBH is finally seeded. We note that in each halo the SFHs are almost identical until the first appearance of the SMBH, clearly indicating that AGN feedback is the effect responsible for the differences found between the two configurations.
For most of the simulated dwarfs, a reduction in the global SF (the SF within the virial radius of the halo) in the AGN runs, compared to non-AGN runs, is accompanied by a reduction in central SF (within a spherical radius of 5 kpc). However, in some cases, the suppression of SF is only clear when looking beyond the central 5 kpc: this is the case for the four most massive dwarfs, whose central SF is almost unaltered in the AGN versus non-AGN runs. An extreme case is the SFH of dwarf H0: within 5 kpc of the centre and in the last ∼3 Gyr of its evolution, the SFH is higher in the AGN simulation than in its non-AGN companion simulation, which indicates a sort of positive feedback. We understand this to be driven by an excess of cold gas available at late times, which was prevented from being transformed into stars because early (t ≲ 7 Gyr) AGN feedback heated it up above the SF temperature threshold (see Section 3.7 for the relative discussion). Owing to high-density conditions in such massive dwarf galaxies, cooling times are short enough that such gas can cool back and contribute to late SF in the inner parts of the galaxy. Or, in other words, AGN feedback is not sufficient to suppress the very central SF of massive dwarf galaxies, with masses  , all the way to z = 0 (even though some early suppression in the inner regions of such galaxies at earlier times is found), while it is enough to globally suppress their SF. This issue will be explored in a companion paper on HI gas properties in dwarfs harbouring AGNs (see also discussion in Sect. 3.7).
In order to quantify the dependence of SF on AGN feedback, we next took the ratio of the median SF rate (SFR) in the fiducial configuration, ⟨SFR⟩AGN, and the median SFR in the non-AGN simulations, ⟨SFR⟩non−AGN, both across cosmic times. Galaxies for which this ratio is close to one are not significantly affected by the presence of a central SMBH, while those with a ratio less than one have experienced AGN-induced SF suppression. The left panel of Fig. 6 shows the relation between this ⟨SFR⟩ ratio and the z = 0 SMBH mass of the fiducial sample, for each dwarf. One might expect the reduction in SF due to AGN feedback to directly relate to the mass of the central SMBH. While this is the case, we note that this trend presents a notable scatter. In the right-hand panel of Fig. 6, we therefore plot the ⟨SFR⟩AGN/⟨SFR⟩non−AGN ratio, versus the BH-stellar mass ratio, MBH/M⋆, for the fiducial sample. This relation shows less scatter compared to the one in which only the SMBH mass is considered, reflecting the importance of taking into account not only the BH mass and related AGN feedback, but also the mass of the galaxy that hosts the SMBH: dwarf galaxies with a more pronounced suppression in SF are not necessarily the ones with the largest SMBH (see for example the similar amount of SF reduction in dwarfs H0 and H5). In other words, larger values of MBH/M⋆ are coincident with a stronger suppression of SF than those galaxies in which the MBH/M⋆ value is low.
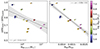 |
Fig. 6. Ratio between the median SFR in the fiducial and non-AGN runs, across cosmic time, for our set of simulated dwarf galaxies, colour-coded by BH mass. In the left-hand panel, the ⟨SFR⟩AGN/⟨SFR⟩non−AGN ratio is shown against the z = 0 BH mass of each galaxy in the fiducial run, as a proxy for the total amount of energy available as AGN feedback. In the right-hand panel, this ratio is instead plotted against the BH mass over the stellar mass of the simulated galaxies: this relation shows much less scatter and a stronger correlation. The solid line and grey-shaded region show the best linear fit and the 1σ error of the sample, respectively. |
Our results are in broad agreement with the work of Pacucci & Loeb (2024), who derived a tight relation between SF suppression and the ratio MBH/M⋆ for high-z galaxies, finding that, at fixed MBH, the heating effect of AGN is efficient in suppressing SF when the galaxy has less stellar mass. Furthermore, simulations from Barai & de Gouveia Dal Pino (2019) find that BHs need to be at least 105 M⊙ in order to suppress SF in dwarf galaxies. Subsequent work from Sharma et al. (2020) shows that, in the ROMULUS25 simulations, the galaxies whose SF is most strongly suppressed are those that host over-massive BHs, while trends for the specific SFR dependence on BH mass are washed out or inverted for galaxies with M⋆ < 6 × 10⁹ M⊙ in the FABLE simulations (Koudmani et al. 2021). Both studies refer to cosmological simulations. Furthermore, a previous idealised simulation work (Koudmani et al. 2019) found that AGN activity in dwarfs is unlikely to regulate the global SFR of the galaxy even with an AGN shining near the Eddington luminosity. All in all, there is no current consensus on the effect of AGN feedback in reducing SF in simulated dwarf galaxies: the reasons for such discrepancies can be multiple, such as differences in resolution, BH seeding, and accretion schemes, as well as details and implementations of AGN feedback models.
3.5. Morphologies
Given the findings highlighted in previous sections, we might expect to see morphological differences in dwarf galaxies run with and without AGN. Fig. 7 shows the face-on and edge-on stellar light projections of our 12 simulated dwarf galaxies for both configurations at z = 0. Each colour represents the i-, g-, and u-band luminosity of the stars enclosed in a box of 30 kpc in radius. Redder and bluer colours indicate older and younger stars, respectively. In general, it can be seen that the morphology of those galaxies hosting a larger SMBH (top row, Halos 0–3) differ more from their counterpart than those hosting a smaller SMBH (bottom row, Halos 9–11). However, a clear correlation between SMBH mass and morphological type is not immediately derivable: some galaxies appear to be more compact once AGNs are included, whilst others are more extended. To better quantify the change in galaxy size due to AGNs, the percentage change in the effective radius between the AGN and non-AGN runs is reported in Table 2. As was anticipated, there is no evident pattern of a systematic change in dwarf galaxies’ morphologies due to the presence of a centrally accreting SMBH.
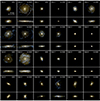 |
Fig. 7. Face-on (30 × 30 kpc) and edge-on (30 × 15 kpc) projected stellar light images of galaxies at z = 0. Each galaxy run with the fiducial model is shown next to its non-AGN counterpart. The colours are based on the i-, g-, and u-band luminosity of stars; old stars are shown in red, and young ones in blue, respectively. From top left to bottom right, galaxies are ordered in decreasing BH mass, as in Fig. 5. |
Effective radius at z = 0 for each simulated dwarf galaxy.
Some previous work, based on idealised simulations of slightly larger galaxies (Choi et al. 2014), suggested that the inclusion of AGNs increases the effective radius of the simulated galaxy only when the associated feedback is mechanical. We recall that our AGN feedback model is purely thermal, which may explain the lack of a clear pattern in augmenting the Reff of the AGN runs. Furthermore, we note that Irodotou et al. (2022) found that MW-mass AURIGA galaxies, in which AGN feedback was included, tend to have systematically higher effective radii than their non-AGN companions: this might indicate that thermal AGNs could be acting differently in the dwarf galaxy regime. We conclude that the lack of a clear, systematic AGN-driven variation in morphology makes it hard to use such an observable to determine the presence or impact of AGN activity in dwarfs.
3.6. Dark matter density profiles
Theoretical studies found that AGNs may affect the DM mass distribution in galaxies, by flattening its inner density profile and creating DM cores (Martizzi et al. 2012; Waterval et al. 2022). To determine whether a similar effect occurs for our dwarf galaxies, we studied the DM profiles of our simulated sample. We plot in the left panel of Fig. 8 the DM profile of two extreme cases: the galaxy that hosts the most massive SMBH, H0, and the one that contains the smallest SMBH, H11. The AGN runs are indicated in blue, and the non-AGN runs in green. The fiducial halo hosting the most massive SMBH shows a non-negligible decrease in its inner DM density relative to its non-AGN counterpart: the former has a core of about 2 kpc in size, well beyond the physical softening length of the simulation. A similar effect is found for the galaxy hosting the second-most massive SMBH (though not shown in this plot for clarity). Overall, these galaxies show a reduction of up to ∼65% in their central DM density, as opposed to the case of the least massive SMBH, found in H11, which essentially does not lead to any significant change in the central DM density.
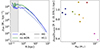 |
Fig. 8. DM profiles and inner slope of the sample. Left-hand panel: DM profiles for the galaxies containing the most massive (H0, solid lines) and least massive (H11, dotted lines) SMBHs. The configuration without an AGN is shown in green, and the AGN run in blue. The grey area shows radii below the simulations’ physical softening length. Right-hand panel: Ratio between the mean DM density profile in the inner region of each galaxy (within the softening length and 1 kpc) in the AGN vs non-AGN configuration, plotted against the z = 0 SMBH mass. |
We note that the galaxy harbouring the most massive SMBH exhibits a non-cuspy distribution irrespective of whether or not AGN feedback is included; that is, its DM density inner slope is already flatter than −1 in the simulations without AGNs (solid green line in Fig. 8, left panel). Consequently, the presence of a massive SMBH does not inherently imply the creation of a DM core from a cuspy profile: instead, it results in a reduction in the density of whatever initial DM distribution was already in place. In our simulations, all but the most massive galaxy (H0) are cuspy in the non-AGN run, and remain cuspy after the inclusion of the central SMBH. They suffer, however, a reduction in their central DM density proportional to the mass of the SMBH. In the right panel of Fig. 8, we show the ratio between the mean of the DM density profile in the inner region of each galaxy (i.e. within radii from the softening length to 1 kpc) for the AGN and non-AGN configuration, as a function of the SMBH mass at z = 0. We see minimal to no change in density for the haloes harbouring SMBHs less massive than 106 M⊙, while more massive haloes produce a reduction in central DM density that is stronger and stronger as we approach the most massive SMBHs of our simulated dwarfs, with MBH = 107 M⊙. This effect is due to AGN-driven gas outflows that, similarly to what happens in the case of SN-generated outflows, reduce the total gravitational force towards the centre of galaxies, allowing DM to move to their outskirts (Pontzen & Governato 2012; Di Cintio et al. 2014, and references therein).
Previous work based on cosmological simulations of massive galaxies including BHs has studied the role of AGN in determining the final DM mass distribution in galaxies. Macciò et al. (2020) show that the AGN generates outflows that can partially counteract the DM baryonic contraction due to the large central stellar component in massive galaxies, effectively relaxing the central DM distribution in their simulated haloes, with masses larger than Mhalo = 3 × 10¹² M⊙. Other simulations, including several different implementations of AGN feedback in dwarf galaxies, consistently produced cuspy DM profiles, even when the AGN worked at maximum efficiency (Koudmani et al. 2022). In such configurations, dynamic heating of DM by AGN feedback, which would lead to the transformation of the galaxy’s central region into a core, was not found. Nevertheless, a subtle yet systematic outcome is predicted towards lower central densities for lower stellar-to-virial mass ratios for the AGN feedback-dominated set-ups (see Fig. 9 of Koudmani et al. 2022).
3.7. Neutral hydrogen properties
A reduced SF in those simulated dwarfs harbouring AGNs implies that such feedback affects the cold, star-forming gas in these galaxies, either by expelling it, or by heating it, or both. In the left panel of Fig. 9, we show the total amount of neutral hydrogen, HI, versus the stellar mass of each galaxy inside the virial radius. As in previous figures, the fiducial, AGN runs are shown as squares, colour-coded by the z = 0 SMBH mass, and the non-AGN ones as black points. Each AGN-non-AGN galaxy pair is connected with a line, to guide the eyes. Here, HI gas was computed following the Leroy et al. (2008) method described in Marinacci et al. (2017). We show observations of isolated dwarfs from Bradford et al. (2015) as green crosses, and their mean MHI-M⋆ relations as green solid lines, while we show the observational threshold below which galaxies are defined as quenched with a dotted-green line. We further show isolated AGN candidates from Bradford et al. (2018) as red crosses.
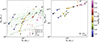 |
Fig. 9. Neutral hydrogen and gas mass vs stellar mass. Left-hand panel: Neutral hydrogen mass vs stellar mass, both quantities measured within the virial radius, for simulated dwarfs with (coloured squares) and without (black points) AGNs. Observational data of isolated dwarfs by Bradford et al. (2015) are shown as green crosses, while AGN candidates are indicated as red crosses, from Bradford et al. (2018). The solid green line represents the best fit of the Bradford et al. (2015) data, while the dotted green line is the threshold below which they define galaxies as being quenched. Right-hand panel: Total gas mass vs stellar mass for our set of simulated dwarf galaxies. |
Fig. 9 clearly shows how the introduction of AGN feedback notably reduces the neutral hydrogen content of our simulated dwarf galaxies, by almost an order of magnitude in some extreme cases (halo H0, H1, and H5), approaching the quenched threshold given in Bradford et al. (2015). Our results match the observational trends reported in Bradford et al. (2018), in which candidate dwarfs hosting AGNs have, on average, less HI gas mass than the isolated non-AGN sample. A similar behaviour is also found in simulations by Sharma et al. (2020) (their Fig. 12), in which galaxies hosting over-massive BHs tend to contain less neutral hydrogen, at a fixed stellar mass, than galaxies hosting less massive BHs. Furthermore, Guo et al. (2022) found that AGN feedback is very efficient in reducing the HI gas for observed low-mass and star-forming galaxies (their Fig. 2), leading to a reduction in HI mass of 1 dex in the low-mass range (109–109.5 M⊙). In the right panel of Fig. 9, we show the total amount of gas versus the M⋆ of each galaxy. It can be appreciated that the reduction in HI gas between the AGN and non-AGN configuration (left-hand panel) is notably larger than the corresponding reduction in total (hot and cold) gas, which is, in most cases, negligible. This supports the notion that AGN feedback predominantly heats the gas rather than expels it completely from the host galaxy.
Fig. 10 further shows the radial profiles of the cumulative mass of all gas (solid line) and neutral hydrogen (dotted lines) in both configurations (AGN in blue, non-AGN in green) at z = 0. In general, galaxies converge to a similar total gas amount at the scale of the virial radius, although this is not the case for neutral hydrogen, for which the fractional difference cumulatively builds up with radius, in some cases showing an order of magnitude more neutral hydrogen in the circumgalactic medium of the non-AGN runs compared to the AGN runs (reflecting the global decrease in SF in such a case).
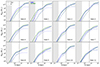 |
Fig. 10. Cumulative gas mass vs galactic radius, for the non-AGN configuration, in green, and the AGN one, in blue. Galaxies are ordered by increasing BH mass, from top left to bottom right. The total gas mass is shown as a solid line, and HI gas as a dotted line. The grey area indicates radii below the simulations’ physical softening length, while the vertical line highlights a radius of 5 kpc, to facilitate a comparison with the SFHs in the inner galaxy region shown in Fig. 5. |
While for the least massive galaxies (H4–H11) there is less HI mass at 5 kpc in AGN compared to the non-AGN configuration, leading to a central SF suppression within this radius (visible in Fig. 5), the four most massive haloes (H0–H3) contain a similar amount of HI gas in AGN versus non-AGN runs in their inner regions: the HI reduction happens mostly in the outskirts of the galaxies, rather than in the very central kiloparsecs. In these massive haloes (corresponding to M⋆ > 2 × 10⁹ M⊙), AGNs are able to warm up the very central regions of galaxies at high-z, during what is typically the maximum SMBH accretion phase, but such gas is then able to cool back down by z = 0, and indeed even form stars (see SFH of H0–H3 within 5 kpc, Fig. 5). We verified this claim by studying the HI mass profile versus time in the most massive galaxy, H0, shown in Fig. 11. At high-z, as was expected, less HI was present in the AGN configuration in the inner region, compared to the non-AGN one, leading to a high-z suppression of central SF in the AGN case. Over time, the HI amount in the inner 5 kpc became more similar in the AGN versus non-AGN case, showing an effective cooling back of such gas that leads to new episodes of SF in the centre at later times. In other words, in our simulations, AGNs do not seem able to keep the gas warm in the central regions of massive dwarfs all the way to z = 0, while they are able to globally reduce the HI fraction compared to galaxies run without a BH. This is also clearly seen in the SFHs of Fig. 5: galaxies run with AGNs are not quenched in their inner few kiloparsecs at z = 0.
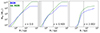 |
Fig. 11. Cumulative HI mass vs galactic radius for the galaxy harbouring the largest BH at three different redshifts, H0. The non-AGN configuration is represented in green, and the AGN one in blue. The grey area indicates radii below the simulations’ physical softening length at the corresponding redshift, while the vertical line highlights a radius of 5 kpc, shown in Fig 10, to facilitate a comparison with the SFHs in the inner galaxy region (Fig. 5). |
Existing literature shows results in partial agreement with ours. In the idealised set-up of Koudmani et al. (2019), who run a galaxy with M⋆ = 2 × 10⁹ M⊙ (therefore matching the stellar mass of our most massive haloes, H0–H3), the authors found that in runs with AGN feedback, central SFRs are systematically suppressed, in particular at high instantaneous SF efficiencies, ϵSF, while at lower ϵSF, central suppression in SF is not found by the end of their simulation (see their Fig. 6, top panels, and note the larger amount of total gas in the inner region of their galaxy in the AGN run).
Studying in detail the complex interplay between AGN feedback, outflow properties, and gas angular momentum, as a function of BH and galaxy mass, is a not trivial matter and requires a dedicated analysis, tracing the history of feedback-driven outflows, inflows, and gas recycling. This is beyond the scope of this paper, and we defer such an analysis to a future work (Arjona-Gálvez et al., in prep.).
4. Conclusions
In recent years, a wealth of observations have revealed actively accreting central black holes (AGNs) within dwarf galaxies. This discovery suggests a previously unexplored avenue, raising the possibility that AGNs may play a fundamental role not only in the evolution of massive galaxies but also in that of low-mass ones. In this study, we have used zoom-in cosmological simulations of 12 dwarf galaxy haloes, with 108.3 M⊙ ≤ M⋆ ≤ 109.8 M⊙ and a physical softening length of 250 h−1 pc at z = 0, to investigate the impact of AGN feedback on the evolution of such low-mass galaxies. We ran two simulations for each set of initial conditions: one with the full physics model including AGN feedback, and one without AGN feedback. The key findings of our work are summarised as follows:
-
The BH seeding and accretion model used generates galaxies with central SMBHs that reproduce the trends of well-known observational relations, such as the MBH-M⋆ and MBH-σ⋆ relation (Figs. 1 and 2), as well as galaxies that lie within a 1 sigma scatter of the expected M⋆-M200 relation (Fig. 3), and thus represents the ideal starting point for our research;
-
The AGN feedback reduces the global SF of dwarf galaxies by as much as a factor of two for galaxies hosting SMBHs with masses ≳106 M⊙ (Fig. 5). Most of this reduction occurs during the maximum SMBH accretion phase, suggesting that this type of feedback is a viable way of suppressing SF in low-mass dwarfs, even though none of our galaxies is completely quenched by z = 0. The amount of SF suppression strongly correlates with the ratio between the SMBH and the galaxy stellar mass (Fig. 6), indicating that the impact of AGNs depends not only on the final SMBH mass but also on the global properties of the galaxy it lives in;
-
No evident pattern of a systematic change in dwarf galaxies morphologies due to the presence of a centrally accreting SMBH is predicted (Table 2 and Fig. 7): some galaxies are more compact once AGNs are included, while others are more extended. The dominant AGN thermal feedback used in AURIGA could explain the lack of a systematic change in the size (effective radius) of the galaxies;
-
A systematic reduction of the inner DM density in dwarfs run with AGNs is found, proportional to the z = 0 SMBH mass (Fig. 8): galaxies hosting SMBHs with MBH ≳ 106 M⊙ experience a significant decrease in their central DM, of up to ∼65%, compared to their non-AGN counterparts, while less massive SMBHs lead to a negligible reduction;
-
The AGN feedback is able to push gas away from the galactic centre, but it is not able to expel it completely from the galaxy virial radius: galaxies run with AGNs have a similar amount of total gas compared to galaxies run without AGNs. However, less HI is found in the AGN configuration (Fig. 9) by almost an order of magnitude in the galaxies harbouring the most massive SMBHs, compatible with the suppression of SF found therein. This in turn leads to a better match to the BTFR, compared to the non-AGN runs (Fig. 4);
-
Studying in detail the radial profile of neutral hydrogen (Fig. 10), we typically found a reduction of HI at all radii, including within the innermost kiloparsecs of the AGN dwarfs, compared to their non-AGN companions. However, in the four most massive galaxies (M⋆ > 2 × 10⁹ M⊙), HI profiles are similar in the two configurations within the central 5 kpc: such massive dwarfs have a non-negligible residual SF within their inner regions at z = 0. We verified that AGNs are able to warm up the gas and suppress SF in the very central regions of galaxies with M⋆ ≳ 109 M⊙ at high-z (Fig. 11), during what is typically the maximum SMBH accretion phase, but such gas is then able to cool back down by z = 0, and indeed even form stars (see SFH of H0–H3 within 5 kpc, Fig. 5). A dedicated analysis of the gas angular momentum distribution and outflow properties of dwarfs hosting AGNs is deferred to a future paper.
Cosmological simulations serve as a valuable tool with which to investigate the significance of AGN feedback in the realm of low-mass galaxies. Previous observational and theoretical studies have pinpointed the potential influence that an accreting SMBH can have on dwarf galaxies’ evolution. Our pilot work, in which dwarf galaxies are simulated with and without the inclusion of AGNs, at high resolution and within a fully cosmological context, highlights the importance of properly modelling AGN feedback, shedding light on the impact of this scarcely studied source of feedback at the lowest mass scales.
We caution the reader that the stellar and halo mass ranges explored in this work cover the most massive dwarf galaxy regime only, and that the obtained results are dependent on the particular AGN feedback scheme implemented in the code. In the future, extending the sample to less massive dwarf galaxies will provide valuable insights into identifying the minimum BH and galaxy mass, if any, above which AGN feedback starts being important. Additionally, a comprehensive exploration employing various state-of-the-art AGN feedback schemes will be pivotal to testing this hypothesis.
The ICs were generated using the PANPHASIA code (Jenkins 2013; Jenkins & Booth 2013). Zoom-in simulations of these objects run with the original AURIGA physics model are publicly available as massive dwarf galaxies described in Grand et al. (2024).
Acknowledgments
E. Arjona-Gálvez acknowledges support from the Agencia Espacial de Investigación del Ministerio de Ciencia e Innovación (AEI-MICIN) and the European Social Fund (ESF+) through a FPI grant PRE2020-096361. A. Di Cintio is supported by a Junior Leader fellowship from ‘La Caixa’ Foundation (ID 100010434), code LCF/BQ/PR20/11770010. R. Grand acknowledges financial support from the Spanish Ministry of Science and Innovation (MICINN) through the Spanish State Research Agency, under the Severo Ochoa Program 2020–2023 (CEX2019-000920-S), and support from an STFC Ernest Rutherford Fellowship (ST/W003643/1). This research made use of the LaPalma HPC cluster at the Instituto de Astrofisica de Canarias, under project can43, PI A. Di Cintio. The authors thankfully acknowledge the technical expertise and assistance provided by the Spanish Supercomputing Network (Red Española de Supercomputacion, RES). We gratefully thank Alexander Knebe and Salvador Cardona-Barrero for help with the halo-finder AHF and the software PYNBODY.
References
- Anglés-Alcázar, D., Faucher-Giguère, C.-A., Quataert, E., et al. 2017, MNRAS, 472, L109 [Google Scholar]
- Baldassare, V. F., Reines, A. E., Gallo, E., & Greene, J. E. 2015, ApJ, 809, L14 [NASA ADS] [CrossRef] [Google Scholar]
- Baldassare, V. F., Reines, A. E., Gallo, E., & Greene, J. E. 2017, ApJ, 836, 20 [NASA ADS] [CrossRef] [Google Scholar]
- Baldassare, V. F., Geha, M., & Greene, J. 2020, ApJ, 896, 10 [NASA ADS] [CrossRef] [Google Scholar]
- Barai, P., & de Gouveia Dal Pino, E. M. 2019, MNRAS, 487, 5549 [NASA ADS] [CrossRef] [Google Scholar]
- Bellovary, J. M., Cleary, C. E., Munshi, F., et al. 2019, MNRAS, 482, 2913 [NASA ADS] [Google Scholar]
- Binney, J., & Tabor, G. 1995, MNRAS, 276, 663 [NASA ADS] [Google Scholar]
- Bondi, H. 1952, MNRAS, 112, 195 [Google Scholar]
- Bondi, H., & Hoyle, F. 1944, MNRAS, 104, 273 [Google Scholar]
- Bower, R. G., Schaye, J., Frenk, C. S., et al. 2017, MNRAS, 465, 32 [NASA ADS] [CrossRef] [Google Scholar]
- Boylan-Kolchin, M., Bullock, J. S., & Kaplinghat, M. 2012, MNRAS, 422, 1203 [NASA ADS] [CrossRef] [Google Scholar]
- Bradford, J. D., Geha, M. C., & Blanton, M. R. 2015, ApJ, 809, 146 [NASA ADS] [CrossRef] [Google Scholar]
- Bradford, J. D., Geha, M. C., Greene, J. E., Reines, A. E., & Dickey, C. M. 2018, ApJ, 861, 50 [NASA ADS] [CrossRef] [Google Scholar]
- Brook, C. B., & Di Cintio, A. 2015, MNRAS, 450, 3920 [CrossRef] [Google Scholar]
- Brook, C. B., Santos-Santos, I., & Stinson, G. 2016, MNRAS, 459, 638 [CrossRef] [Google Scholar]
- Bullock, J. S. 2010, ArXiv e-prints [arXiv:1009.4505] [Google Scholar]
- Bundy, K. 2015, in Galaxy Masses as Constraints of Formation Models, eds. M. Cappellari, & S. Courteau, 311, 100 [Google Scholar]
- Chilingarian, I. V., Katkov, I. Y., Zolotukhin, I. Y., et al. 2018, ApJ, 863, 1 [Google Scholar]
- Choi, E., Naab, T., Ostriker, J. P., Johansson, P. H., & Moster, B. P. 2014, MNRAS, 442, 440 [NASA ADS] [CrossRef] [Google Scholar]
- Dashyan, G., Silk, J., Mamon, G. A., Dubois, Y., & Hartwig, T. 2018, MNRAS, 473, 5698 [CrossRef] [Google Scholar]
- Davis, M., Efstathiou, G., Frenk, C. S., & White, S. D. M. 1985, ApJ, 292, 371 [Google Scholar]
- de Blok, W. J. G. 2010, Adv. Astron., 2010, 789293 [CrossRef] [Google Scholar]
- Dekel, A., & Silk, J. 1986, ApJ, 303, 39 [Google Scholar]
- Di Cintio, A., & Lelli, F. 2016, MNRAS Lett., 456, L127 [Google Scholar]
- Di Cintio, A., Brook, C. B., Macciò, A. V., et al. 2014, MNRAS, 437, 415 [Google Scholar]
- Di Matteo, T., Springel, V., & Hernquist, L. 2005, in Growing Black Holes: Accretion in a Cosmological Context, eds. A. Merloni, S. Nayakshin, & R. A. Sunyaev, 340 [Google Scholar]
- Dubois, Y., Pichon, C., Welker, C., et al. 2014, MNRAS, 444, 1453 [Google Scholar]
- Dubois, Y., Volonteri, M., Silk, J., et al. 2015, MNRAS, 452, 1502 [Google Scholar]
- Engler, C., Pillepich, A., Pasquali, A., et al. 2021, MNRAS, 507, 4211 [NASA ADS] [CrossRef] [Google Scholar]
- Ferrarese, L., & Merritt, D. 2000, ApJ, 539, L9 [Google Scholar]
- Flores, R. A., & Primack, J. R. 1994, ApJ, 427, L1 [NASA ADS] [CrossRef] [Google Scholar]
- Garrison-Kimmel, S., Boylan-Kolchin, M., Bullock, J. S., & Kirby, E. N. 2014, MNRAS, 444, 222 [NASA ADS] [CrossRef] [Google Scholar]
- Girelli, G., Pozzetti, L., Bolzonella, M., et al. 2020, A&A, 634, A135 [NASA ADS] [CrossRef] [EDP Sciences] [Google Scholar]
- Governato, F., Brook, C., Mayer, L., et al. 2010, Nature, 463, 203 [NASA ADS] [CrossRef] [Google Scholar]
- Grand, R. J. J., Gómez, F. A., & Marinacci, F. 2017, MNRAS, 467, stx071 [CrossRef] [Google Scholar]
- Grand, R. J. J., Fragkoudi, F., Gómez, F. A., et al. 2024, MNRAS, 532, 1814 [NASA ADS] [CrossRef] [Google Scholar]
- Greene, J. E., & Ho, L. C. 2004, ApJ, 610, 722 [NASA ADS] [CrossRef] [Google Scholar]
- Greene, J. E., & Ho, L. C. 2007, ASP Conf. Ser., 373, 33 [NASA ADS] [Google Scholar]
- Greene, J. E., Strader, J., & Ho, L. C. 2020, ARA&A, 58, 257 [Google Scholar]
- Guo, Q., White, S., Li, C., & Boylan-Kolchin, M. 2010, MNRAS, 404, 1111 [NASA ADS] [Google Scholar]
- Guo, H., Jones, M. G., & Wang, J. 2022, ApJ, 933, L12 [NASA ADS] [CrossRef] [Google Scholar]
- Habouzit, M., Volonteri, M., & Dubois, Y. 2017, MNRAS, 468, 3935 [NASA ADS] [CrossRef] [Google Scholar]
- Haidar, H., Habouzit, M., Volonteri, M., et al. 2022, MNRAS, 514, 4912 [NASA ADS] [CrossRef] [Google Scholar]
- Henden, N. A., Puchwein, E., Shen, S., & Sijacki, D. 2018, MNRAS, 479, 5385 [CrossRef] [Google Scholar]
- Homma, D., Chiba, M., Komiyama, Y., et al. 2024, PASJ, 76, 733 [NASA ADS] [CrossRef] [Google Scholar]
- Irodotou, D., Fragkoudi, F., Pakmor, R., et al. 2022, MNRAS, 513, 3768 [NASA ADS] [CrossRef] [Google Scholar]
- Jenkins, A. 2013, MNRAS, 434, 2094 [NASA ADS] [CrossRef] [Google Scholar]
- Jenkins, A., Booth, S., et al. 2013, ArXiv e-prints [arXiv:1306.5771] [Google Scholar]
- Kauffmann, G., White, S. D. M., & Guiderdoni, B. 1993, MNRAS, 264, 201 [Google Scholar]
- Klypin, A., Kravtsov, A. V., Valenzuela, O., & Prada, F. 1999, ApJ, 522, 82 [Google Scholar]
- Knollmann, S. R., & Knebe, A. 2009, ApJS, 182, 608 [Google Scholar]
- Koudmani, S., Sijacki, D., Bourne, M. A., & Smith, M. C. 2019, MNRAS, 484, 2047 [NASA ADS] [CrossRef] [Google Scholar]
- Koudmani, S., Henden, N. A., & Sijacki, D. 2021, MNRAS, 503, 3568 [CrossRef] [Google Scholar]
- Koudmani, S., Sijacki, D., & Smith, M. C. 2022, MNRAS, 516, 2112 [NASA ADS] [CrossRef] [Google Scholar]
- Larson, R. B. 1974, MNRAS, 169, 229 [NASA ADS] [CrossRef] [Google Scholar]
- Leroy, A. K., Walter, F., Brinks, E., et al. 2008, AJ, 136, 2782 [Google Scholar]
- Macciò, A. V., Crespi, S., Blank, M., & Kang, X. 2020, MNRAS, 495, L46 [Google Scholar]
- Marinacci, F., Grand, R. J. J., Pakmor, R., et al. 2017, MNRAS, 466, 3859 [Google Scholar]
- Martín-Navarro, I., & Mezcua, M. 2018, ApJ, 855, L20 [NASA ADS] [CrossRef] [Google Scholar]
- Martizzi, D., Teyssier, R., Moore, B., & Wentz, T. 2012, MNRAS, 422, 3081 [NASA ADS] [CrossRef] [Google Scholar]
- McGaugh, S. S. 2012, ApJ, 143, 40 [CrossRef] [Google Scholar]
- Menon, H., Wesolowski, L., Zheng, G., et al. 2015, Comput. Astrophys. Cosmol., 2, 1 [NASA ADS] [CrossRef] [Google Scholar]
- Mezcua, M., & Domínguez Sánchez, H. 2020, ApJ, 898, L30 [Google Scholar]
- Mezcua, M., & Domínguez Sánchez, H. 2024, MNRAS, 528, 5252 [NASA ADS] [CrossRef] [Google Scholar]
- Mezcua, M., Civano, F., Fabbiano, G., Miyaji, T., & Marchesi, S. 2016, ApJ, 817, 20 [Google Scholar]
- Moore, B. 1994, Nature, 370, 629 [NASA ADS] [CrossRef] [Google Scholar]
- Moore, B., Ghigna, S., Governato, F., et al. 1999, ApJ, 524, L19 [Google Scholar]
- Moster, B. P., Naab, T., & White, S. D. M. 2013, MNRAS, 428, 3121 [Google Scholar]
- Müller, O., Pawlowski, M. S., Revaz, Y., et al. 2024, A&A, 684, L6 [NASA ADS] [CrossRef] [EDP Sciences] [Google Scholar]
- Nulsen, P. E. J., & Fabian, A. C. 2000, MNRAS, 311, 346 [NASA ADS] [CrossRef] [Google Scholar]
- Okamoto, T., Gao, L., & Theuns, T. 2008, MNRAS, 390, 920 [Google Scholar]
- Oman, K. A., Navarro, J. F., Fattahi, A., et al. 2015, MNRAS, 452, 3650 [CrossRef] [Google Scholar]
- Pacucci, F., & Loeb, A. 2024, ApJ, 964, 154 [NASA ADS] [CrossRef] [Google Scholar]
- Pakmor, R., Springel, V., Bauer, A., et al. 2016, MNRAS, 455, 1134 [Google Scholar]
- Pakmor, R., Gómez, F. A., Grand, R. J. J., et al. 2017, MNRAS, 469, 3185 [NASA ADS] [CrossRef] [Google Scholar]
- Pawlik, A. H., & Schaye, J. 2009, MNRAS, 396, L46 [NASA ADS] [CrossRef] [Google Scholar]
- Penny, S. J., Masters, K. L., Smethurst, R., et al. 2018, MNRAS, 476, 979 [NASA ADS] [CrossRef] [Google Scholar]
- Pillepich, A., Springel, V., Nelson, D., et al. 2018, MNRAS, 473, 4077 [Google Scholar]
- Planck Collaboration XVI. 2014, A&A, 571, A16 [NASA ADS] [CrossRef] [EDP Sciences] [Google Scholar]
- Pontzen, A., & Governato, F. 2012, MNRAS, 421, 3464 [NASA ADS] [CrossRef] [Google Scholar]
- Pontzen, A., Roškar, R., Stinson, G., & Woods, R. 2013, Astrophysics Source Code Library [record ascl:1305.002] [Google Scholar]
- Read, J. I., Wilkinson, M. I., Evans, N. W., Gilmore, G., & Kleyna, J. T. 2006, MNRAS, 367, 387 [NASA ADS] [CrossRef] [Google Scholar]
- Reines, A. E. 2022, Nat. Astron., 6, 26 [NASA ADS] [CrossRef] [Google Scholar]
- Reines, A. E., & Volonteri, M. 2015, ApJ, 813, 82 [NASA ADS] [CrossRef] [Google Scholar]
- Reines, A. E., Greene, J. E., & Geha, M. 2013, ApJ, 775, 116 [Google Scholar]
- Sales, L. V., Wetzel, A., & Fattahi, A. 2022, Nat. Astron., 6, 897 [NASA ADS] [CrossRef] [Google Scholar]
- Santos-Santos, I. M., Di Cintio, A., Brook, C. B., et al. 2018, MNRAS, 473, 4392 [NASA ADS] [CrossRef] [Google Scholar]
- Santos-Santos, I. M. E., Navarro, J. F., Robertson, A., et al. 2020, MNRAS, 495, 58 [NASA ADS] [CrossRef] [Google Scholar]
- Sawala, T., Frenk, C. S., Fattahi, A., et al. 2016, MNRAS, 457, 1931 [Google Scholar]
- Schaye, J., Crain, R. A., Bower, R. G., et al. 2015, MNRAS, 446, 521 [Google Scholar]
- Schramm, M., & Silverman, J. D. 2013, ApJ, 767, 13 [NASA ADS] [CrossRef] [Google Scholar]
- Sharma, R. S., Brooks, A. M., Somerville, R. S., et al. 2020, ApJ, 897, 103 [NASA ADS] [CrossRef] [Google Scholar]
- Shen, S., Wadsley, J., & Stinson, G. 2010, MNRAS, 407, 1581 [NASA ADS] [CrossRef] [Google Scholar]
- Silk, J. 2017, ApJ, 839, L13 [Google Scholar]
- Somerville, R. S. 2002, ApJ, 572, L23 [NASA ADS] [CrossRef] [Google Scholar]
- Springel, V. 2005, MNRAS, 364, 1105 [Google Scholar]
- Springel, V. 2010, MNRAS, 401, 791 [Google Scholar]
- Springel, V., & Hernquist, L. 2003, MNRAS, 339, 289 [Google Scholar]
- Springel, V., Di Matteo, T., & Hernquist, L. 2005, MNRAS, 361, 776 [Google Scholar]
- Stark, D. V., McGaugh, S. S., & Swaters, R. A. 2009, Astron. J., 138, 392 [NASA ADS] [CrossRef] [Google Scholar]
- Stinson, G., Seth, A., Katz, N., et al. 2006, MNRAS, 373, 1074 [NASA ADS] [CrossRef] [Google Scholar]
- Trebitsch, M., Volonteri, M., Dubois, Y., & Madau, P. 2018, MNRAS, 478, 5607 [NASA ADS] [CrossRef] [Google Scholar]
- Truong, N., Pillepich, A., & Werner, N. 2021, MNRAS, 501, 2210 [NASA ADS] [CrossRef] [Google Scholar]
- Vogelsberger, M., Genel, S., Sijacki, D., et al. 2013, MNRAS, 436, 3031 [Google Scholar]
- Vogelsberger, M., Genel, S., Springel, V., et al. 2014, MNRAS, 444, 1518 [Google Scholar]
- Wadsley, J. W., Keller, B. W., & Quinn, T. R. 2017, MNRAS, 471, 2357 [NASA ADS] [CrossRef] [Google Scholar]
- Waterval, S., Elgamal, S., & Nori, M. 2022, MNRAS, 514, 5307 [NASA ADS] [CrossRef] [Google Scholar]
- Weinberger, R., Springel, V., Hernquist, L., et al. 2017, MNRAS, 465, 3291 [Google Scholar]
- Wetzel, A. R., Hopkins, P. F., Kim, J.-H., et al. 2016, ApJ, 827, L23 [NASA ADS] [CrossRef] [Google Scholar]
- White, S. D. M., & Frenk, C. S. 1991, ApJ, 379, 52 [Google Scholar]
- Xiao, T., Barth, A. J., Greene, J. E., et al. 2011, ApJ, 739, 28 [NASA ADS] [CrossRef] [Google Scholar]
Appendix A: Additional information
Comparative between later theoretical studies of AGN in dwarf galaxies using hydrodynamic simulations and this work.
All Tables
z = 0 properties of simulated dwarf galaxies run with and without the inclusion of AGNs.
Comparative between later theoretical studies of AGN in dwarf galaxies using hydrodynamic simulations and this work.
All Figures
|
Fig. 1. BH mass-stellar mass relation for the 12 AURIGA dwarf galaxies run with the fiducial configuration. Each galaxy is shown in a different colour to facilitate comparisons with the figures in the following sections. The solid black line shows the median relation given by Schramm & Silverman (2013), with the dashed line indicating the range below which such a relation is extrapolated and the shaded area showing a 0.2 dex scatter. The dashed cyan line shows the relation of Reines & Volonteri (2015), while the dotted orange line indicates the same relation for Greene et al. (2020) early-type galaxies. For a comparison with ongoing simulation results, we show in green the mean MBH-M⋆ relation from the FABLE simulations suite (Koudmani et al. 2021) and in purple that from the ROMULUS simulation (Sharma et al. 2020). |
| In the text | |
|
Fig. 2. BH mass versus stellar velocity dispersion (σ⋆) relation for our simulated dwarfs, which are indicated as coloured squares. The velocity dispersion of the stellar component has been measured inside 0.5 Reff for each galaxy. Observations from Xiao et al. (2011) are marked by grey points with error bars, with a 0.2 dex scatter as a grey-shaded area. Observations from Baldassare et al. (2020) are marked by black crosses. The green line shows the Martín-Navarro & Mezcua (2018) observational relation obtained for low-mass Seyfert 1 galaxies. All of our simulated galaxies follow fairly well current existing observational relations between the mass of the central SMBH and the velocity dispersion of the galaxy’s stellar component. |
| In the text | |
|
Fig. 3. Stellar-to-halo mass relation of simulated dwarf galaxies: black points represent galaxies run without BHs and AGN feedback, while coloured squares represent those galaxies run in the fiducial model, i.e., including a central SMBH. In this case, each galaxy is shown with a different colour reflecting the mass of its central SMBH. Each fiducial or non-AGN pair (i.e., a simulation with the exact same initial conditions) is connected with a line. In solid blue, the abundance matching relations from Moster et al. (2013) are shown with a scatter of 0.2 dex as a shaded blue region. Estimates of Guo et al. (2010) and Girelli et al. (2020) are shown with dashed dark and dash-dotted purple lines, respectively. Galaxies harbouring SMBHs more massive than ∼ 106 M⊙ have a strongly reduced M⋆ compared to their non-AGN counterparts. |
| In the text | |
|
Fig. 4. Baryonic Tully-Fisher relation of simulated dwarf galaxies, run with (left panel) and without (right panel) the inclusion of BH and AGN feedback. Each galaxy’s baryonic mass is measured within the virial radius and shown in a different colour according to its z = 0 BH mass, as in Fig. 3. Different symbols indicate different ways of measuring the rotational velocity, Vrot: VDM, max, Vflat, and V8h are shown as squares, triangles, and diamonds, respectively. The observational relations given by McGaugh (2012), are depicted with the solid line, and the relation obtained in Di Cintio & Lelli (2016) using semi-analytic models with the dotted line. Simulated galaxies that include AGN feedback are in better agreement with the observed BTFR. |
| In the text | |
|
Fig. 5. SFHs of simulated dwarf galaxies, within the virial radius (shaded histograms) and within 5 kpc of the centre (open histograms). Galaxies that evolved with AGN feedback are represented in blue, while those without AGNs are shown in green, and they are ordered according to their z = 0 BH mass (the most massive SMBH hosted in Halo 0, top left, the least massive one in Halo 11, bottom right). The logarithm of the SMBH accretion rate through time is indicated on the right-hand Y axis in each panel and is shown as a black line. |
| In the text | |
|
Fig. 6. Ratio between the median SFR in the fiducial and non-AGN runs, across cosmic time, for our set of simulated dwarf galaxies, colour-coded by BH mass. In the left-hand panel, the ⟨SFR⟩AGN/⟨SFR⟩non−AGN ratio is shown against the z = 0 BH mass of each galaxy in the fiducial run, as a proxy for the total amount of energy available as AGN feedback. In the right-hand panel, this ratio is instead plotted against the BH mass over the stellar mass of the simulated galaxies: this relation shows much less scatter and a stronger correlation. The solid line and grey-shaded region show the best linear fit and the 1σ error of the sample, respectively. |
| In the text | |
|
Fig. 7. Face-on (30 × 30 kpc) and edge-on (30 × 15 kpc) projected stellar light images of galaxies at z = 0. Each galaxy run with the fiducial model is shown next to its non-AGN counterpart. The colours are based on the i-, g-, and u-band luminosity of stars; old stars are shown in red, and young ones in blue, respectively. From top left to bottom right, galaxies are ordered in decreasing BH mass, as in Fig. 5. |
| In the text | |
|
Fig. 8. DM profiles and inner slope of the sample. Left-hand panel: DM profiles for the galaxies containing the most massive (H0, solid lines) and least massive (H11, dotted lines) SMBHs. The configuration without an AGN is shown in green, and the AGN run in blue. The grey area shows radii below the simulations’ physical softening length. Right-hand panel: Ratio between the mean DM density profile in the inner region of each galaxy (within the softening length and 1 kpc) in the AGN vs non-AGN configuration, plotted against the z = 0 SMBH mass. |
| In the text | |
|
Fig. 9. Neutral hydrogen and gas mass vs stellar mass. Left-hand panel: Neutral hydrogen mass vs stellar mass, both quantities measured within the virial radius, for simulated dwarfs with (coloured squares) and without (black points) AGNs. Observational data of isolated dwarfs by Bradford et al. (2015) are shown as green crosses, while AGN candidates are indicated as red crosses, from Bradford et al. (2018). The solid green line represents the best fit of the Bradford et al. (2015) data, while the dotted green line is the threshold below which they define galaxies as being quenched. Right-hand panel: Total gas mass vs stellar mass for our set of simulated dwarf galaxies. |
| In the text | |
|
Fig. 10. Cumulative gas mass vs galactic radius, for the non-AGN configuration, in green, and the AGN one, in blue. Galaxies are ordered by increasing BH mass, from top left to bottom right. The total gas mass is shown as a solid line, and HI gas as a dotted line. The grey area indicates radii below the simulations’ physical softening length, while the vertical line highlights a radius of 5 kpc, to facilitate a comparison with the SFHs in the inner galaxy region shown in Fig. 5. |
| In the text | |
|
Fig. 11. Cumulative HI mass vs galactic radius for the galaxy harbouring the largest BH at three different redshifts, H0. The non-AGN configuration is represented in green, and the AGN one in blue. The grey area indicates radii below the simulations’ physical softening length at the corresponding redshift, while the vertical line highlights a radius of 5 kpc, shown in Fig 10, to facilitate a comparison with the SFHs in the inner galaxy region (Fig. 5). |
| In the text | |
Current usage metrics show cumulative count of Article Views (full-text article views including HTML views, PDF and ePub downloads, according to the available data) and Abstracts Views on Vision4Press platform.
Data correspond to usage on the plateform after 2015. The current usage metrics is available 48-96 hours after online publication and is updated daily on week days.
Initial download of the metrics may take a while.