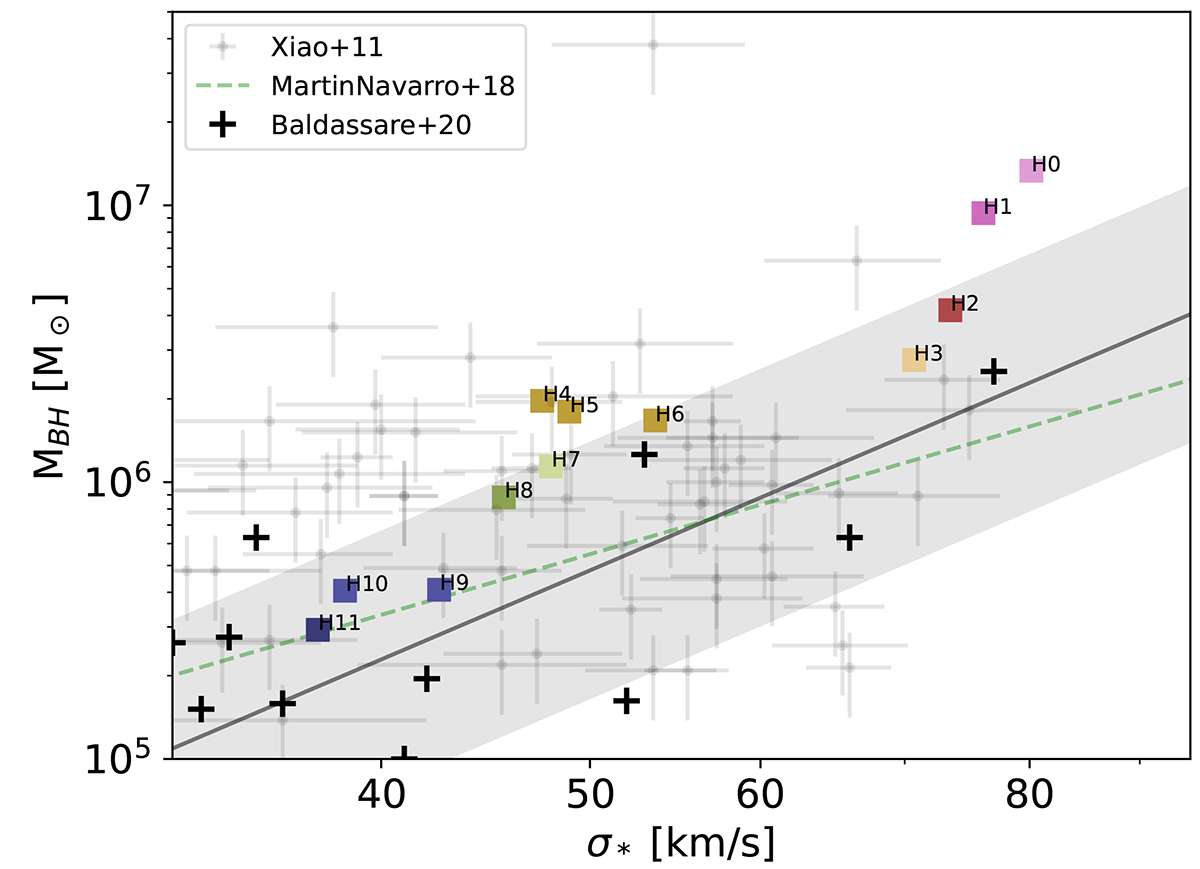
Fig. 2.
Download original image
BH mass versus stellar velocity dispersion (σ⋆) relation for our simulated dwarfs, which are indicated as coloured squares. The velocity dispersion of the stellar component has been measured inside 0.5 Reff for each galaxy. Observations from Xiao et al. (2011) are marked by grey points with error bars, with a 0.2 dex scatter as a grey-shaded area. Observations from Baldassare et al. (2020) are marked by black crosses. The green line shows the Martín-Navarro & Mezcua (2018) observational relation obtained for low-mass Seyfert 1 galaxies. All of our simulated galaxies follow fairly well current existing observational relations between the mass of the central SMBH and the velocity dispersion of the galaxy’s stellar component.
Current usage metrics show cumulative count of Article Views (full-text article views including HTML views, PDF and ePub downloads, according to the available data) and Abstracts Views on Vision4Press platform.
Data correspond to usage on the plateform after 2015. The current usage metrics is available 48-96 hours after online publication and is updated daily on week days.
Initial download of the metrics may take a while.