| Issue |
A&A
Volume 668, December 2022
|
|
|---|---|---|
| Article Number | A123 | |
| Number of page(s) | 10 | |
| Section | Cosmology (including clusters of galaxies) | |
| DOI | https://doi.org/10.1051/0004-6361/202244078 | |
| Published online | 12 December 2022 | |
Mass assembly and active galactic nucleus activity at z ≳ 1.5 in the dense environment of XDCP J0044.0–2033
1
INAF-Osservatorio Astronomico di Arcetri, Largo Enrico Fermi 5, 50125 Florence, Italy
e-mail: This email address is being protected from spambots. You need JavaScript enabled to view it.
2
INAF-Osservatorio Astronomico di Roma, Via di Frascati 33, 00078 Monteporzio Catone, Rome, Italy
3
Università degli Studi di Milano Bicocca, Piazza dell’Ateneo Nuovo 1, 20126 Milan, Italy
4
Max Planck Institut für Extraterrestrische Physik, Giessenbachstrasse 1, 85748 Garching, Germany
Received:
21
May
2022
Accepted:
31
October
2022
Abstract
Context. XDCP J0044.0−2033 is the most massive galaxy cluster known at z > 1.5 and its core shows a high density of galaxies, which are experiencing mergers and hosting nuclear activity.
Aims. We present a multi-wavelength study of a region of 24 kpc × 24 kpc located ∼157 kpc from the center of the cluster, for which we have photometric and spectroscopic observations. Our main goal is to investigate the environmental effects acting on the galaxies inhabiting this high-density region.
Methods. We performed source identification and a photometric analysis on high-resolution Hubble Space Telescope (HST) images in the F105W, F140W, and F160W bands and a spectroscopic analysis of the near-infrared (NIR) KMOS data in H and YJ bands. In addition, we analyzed the deep Chandra ACIS-S X-ray exposure.
Results. We find that the analyzed region hosts at least nine different sources –six of them confirmed to be cluster members within a narrow redshift range 1.5728 < z < 1.5762– and is therefore denser than the very central, more massive region of the cluster previously analyzed. These sources form two different complexes (Complex M and Complex N) at a projected distance of ∼13 kpc, which are undergoing merging on an estimated timescale of 10−30 Myr. One of the sources shows the presence of a broad Hα emission line and is classified as a Type-1 active galactic nucleus (AGN). This AGN is associated to an X-ray point-like source whose emission appears moderately obscured (with intrinsic absorption NH ∼ 1022 cm−2) and hosts a relatively massive black hole (BH) with a mass of MBH ∼ 107 M⊙, which is accreting with an Eddington ratio of ∼0.2.
Conclusions. We conclude that the region analyzed here is consistent with being the formation site of a secondary brightest cluster galaxy (BCG). These findings, together with an in-depth analysis of the X-ray morphology of the cluster, suggest a merging scenario for the entire cluster, with two massive halos both harboring two rapidly evolving BCGs on the verge of being assembled. Our results are also consistent with the scenario in which the AGN phase in member galaxies is triggered by gas-rich mergers and plays a relevant role in the formation of the red sequence of elliptical galaxies observed in the center of local galaxy clusters.
Key words: galaxies: active / galaxies: clusters: individual: XDCP J0044.0–2033 / Galaxy: evolution / galaxies: interactions / galaxies: high-redshift / galaxies: star formation
© The Authors 2022
 Open Access article, published by EDP Sciences, under the terms of the Creative Commons Attribution License (https://creativecommons.org/licenses/by/4.0), which permits unrestricted use, distribution, and reproduction in any medium, provided the original work is properly cited.
This article is published in open access under the Subscribe-to-Open model. This email address is being protected from spambots. You need JavaScript enabled to view it. to support open access publication.
1. Introduction
The standard ΛCDM cosmological model predicts a hierarchical scenario for the formation and evolution of large-scale structures in an expanding Universe (Bond et al. 1991). In this scenario, the first structures in the Universe are halos of dark matter (DM) that, through merging, form increasingly massive halos. The baryonic matter then falls into the potential wells of these DM halos and, through gas accretion and/or merging, forms stars and galaxies (White & Rees 1978).
Eventually, the environment in which a galaxy is located influences its evolution. In particular, this evolution depends on the presence of cold molecular gas and, in dense environments, processes such as galaxy–galaxy mergers (Aarseth & Fall 1980; Park & Hwang 2009), harassment (Moore et al. 1996), strangulation (Balogh et al. 2000; van den Bosch et al. 2008), and ram-pressure stripping (Gunn & Gott 1972; McCarthy et al. 2008) can occur and affect the transportation of the cold gas, thus accelerating the evolution of a galaxy.
Galaxy clusters are ideal laboratories for studying the effects of dense environments on the evolution of galaxies and their properties, especially in their early phases when gas-rich, rapidly forming galaxies strongly interact with each other. In this framework, the study of galaxy clusters at different redshifts is key to understanding the role of the environment in the evolution, or transition, from star forming galaxies (SFGs) to red and passive galaxies (Alberts et al. 2016).
On one hand, in the local Universe, and up to z ∼ 1.4, the dense cores of galaxy clusters are preferentially populated by massive early-type galaxies that form a tight sequence in the color-magnitude diagram (CMD), the so-called red sequence (Bell et al. 2004). Among them, the BCGs, typically giant ellipticals, stand out because of their high luminosity (MV ∼ −23) and stellar mass (M ∼ 1012 M⊙). While at z < 1.4, the SFGs are preferentially located in the cluster outskirts, where the local galaxy density is low, a reversal of the star formation(SF)–density relation starts to appear at z ≳ 1.4. Therefore, massive high-redshift galaxy clusters host more SFGs in their core (Brodwin et al. 2013), forming the so-called blue sequence (Bell et al. 2004), and may not show the presence of a BCG. This inversion suggests that the galaxy cluster populations undergo one or more processes able to affect the SF activity in a relatively short time.
Also, the AGN activity in cluster galaxies shows a similar trend to that seen in SFGs. For example, Alberts et al. (2016), studying SF and AGN activity in 11 galaxy clusters at 1 < z < 1.75, found evidence for co-evolution of SF and AGNs driven by merger activity. These results, in agreement with semi-analytic models and simulations, predicts a scenario in which galaxy major mergers induce starburst and also fuel BH accretion, triggering an AGN phase (Hopkins et al. 2006). Later, the feedback phase of AGNs, in the form of winds and outflows, leads to SF quenching and to the formation of passive elliptical galaxies, such as those observed in clusters in the local Universe (Narayanan et al. 2010). However, it is not clear yet what drives these processes and how galaxy properties can be influenced by the presence of nuclear activity and vice versa. In this context, z ∼ 1 − 2 is a crucial epoch for observing young galaxy clusters, because this is where we expect a high rate of mergers among galaxies and a higher rate of nuclear and SF activity.
Over the years, several large-area surveys have been designed to reveal high-redshift, massive (M ≳ 1014 M⊙) galaxy clusters using optical, infrared, and X-ray observations. Among them, the Spitzer Adaptation of the Red-sequence Cluster Survey (SpARCS; Wilson et al. 2006) is based on the detection of distant clusters by means of their red galaxy population; the South Pole Telescope (SPT; Williamson et al. 2011) and the Atacama Cosmology Telescope (ACT; Menanteau et al. 2010) are based on the Sunyaev-Zel’dovich effect (SZ); and the XMM-Newton Distant Cluster Project (XDCP; Fassbender et al. 2011a) is based on the study of diffuse X-ray emission from the intracluster medium (ICM).
With these surveys, it was possible to state that the SF–density relation gradually changes starting from z > 1 (e.g. Hilton et al. 2010; Fassbender et al. 2011b, 2014; Tadaki et al. 2012; Santos et al. 2015). Also, a decline in SF in clusters over cosmic time (Alberts et al. 2014) with a simultaneous decrease in BH activity has been unambiguously observed and quantified. The fraction of AGNs falls by two orders of magnitude in clusters from z ∼ 1.5 to z ∼ 0 (Galametz et al. 2009; Martini et al. 2013), with AGNs preferentially residing in the infall regions of clusters (Pimbblet et al. 2013). Simultaneously quantifying the effects of cosmic evolution and environmental effects is therefore key to understanding the evolution of massive galaxies.
In this paper, we focus on the high-z galaxy cluster XDCP J0044.0−2033 (otherwise known as the “Gioiello” cluster, hereafter XDCP0044; Fassbender et al. 2011b; Santos et al. 2011), the most massive cluster known at z > 1.5 (see Fig. 1, left panel). XDCP0044 was found thanks to its extended X-ray emission, which was discovered during the XDCP survey (Fassbender et al. 2011b). Deep Chandra observations confirmed strong diffuse emission (with centroid coordinates RA = 00:44:05.2 and Dec = −20:33:59.7) typical of virialized clusters (Tozzi et al. 2014). XDCP0044 is thus in a relatively advanced dynamical state and is an ideal laboratory for studying the mass assembly at high z, the interplay between galaxies, nuclear activity, and the intergalactic gas in dense environment.
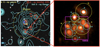 |
Fig. 1. HST images of XDCP0044 and the region analyzed in this work. Left Panel: adapted from Travascio et al. (2020): HST RGB (F105W + F104W + F160W) image of XDCP0044 with overlaid the soft ([0.5−2] keV) bands X-ray contours. The yellow circle is centered on the X-ray extended emission centroid (yellow cross, RA = 00:44:05.2 and Dec = −20:33:59.8) and has a radius of 30 arcsec, corresponding to ∼250 kpc. The red circles mark the 5 X-ray point-like sources detected by Tozzi et al. (2014). Right Panel: HST image in F105W band. The yellow circles mark the sources detected in ground based HAWK-I J and Ks bands by Fassbender et al. (2014) while cyan circles mark the sources detected in HST. The magenta square is the KMOS field of view. |
Concerning the galaxy population, XDCP0044 shows a strong inversion of the SF–density relation. Indeed, Santos et al. (2015) found that the total SF rate within the projected core area (r < 250 kpc) is SFR = 1875 ± 158 M⊙ yr−1 (considering only the spectroscopic members), which is four times higher than the SFR in the cluster outskirts. In addition, X-ray point-like emission has been detected from at least two member galaxies within ∼250 kpc from the cluster center (labeled “3” and “5” in the left panel of Fig. 1). Two additional unresolved X-ray sources may turn out to be additional cluster members, but redshift measurements are not yet available. Furthermore, radio Jansky Very Large Array (JVLA) data reveal the presence of at least four sources emitting in the radio band and extended radio emission associated to Complex A (see Travascio et al. 2020). In particular, the core region (∼70 kpc × 70 kpc) of XDCP0044, studied by Travascio et al. (2020), is the densest among those observed at z > 1.5 and shows the presence of two luminous, obscured, and highly accreting AGNs and an optically obscured Type-2 AGN, with signatures of an ongoing merger. The presence of multiple AGN activity and high SF in the core of a high-z cluster suggest that these processes have a key role in shaping the nascent BCGs observed at the center of local clusters.
On the basis of these results, we decided to investigate SF and nuclear activity in another region located ∼157 kpc from the core of XDCP0044 that appears to be extremely dense and active as shown by the presence of an unresolved X-ray source at its center, intense SF at the level of SFR = 825 ± 120 M⊙ yr−1 (source ID 95 in Santos et al. 2015), and the presence of a compact radio source with luminosity L1.5 GHz = 2.6 ± 0.3 × 1024 W Hz−1 (source r3 in Travascio et al. 2020). To perform our study, we used high-resolution HST photometric data combined with K-band multi-object spectrometry provided by the ESO Very Large Telescope (VLT) (KMOS IFU) and X-ray Chandra data. Figure 1 shows the HST RGB (F105W + F140W + F160W) image of XDCP0044 with the soft ([0.5−2.0] keV) band X-ray contours of the extended emission overlaid with the five X-ray point-like sources detected by Tozzi et al. (2014).
The paper is organized as follows. In Sect. 2 we describe the analyzed data while in Sect. 3 we present the source identification and photometric analysis, along with spectroscopic and kinematic analyses. In Sect. 4 we present our detailed analysis of the X-ray AGN. We discuss our findings in Sect. 5, and finally summarize our conclusions in Sect. 6.
2. Observation and data reduction
HST images. HST images of XDCP0044 were obtained in 2015 with the Wide Field Camera 3 (WFC3) in F105W, F140W, F160W, and F814W bands (Program: 13677, PI: S. Perlmutter) with the following exposure times: 4689 s in F105W, 5189 s in F140W, 2595 s in F160W, and 1620 s in F814W. In our analysis, we use the images obtained by combining the archival drizzled (DRZ) frames after performing the astrometry and aligning them. Due to the low signal-to-noise ratio (S/N), the F814W band has not been included (see also Travascio et al. 2020). The depth of the three images at 5σ is [28.53, 28.33, 28.18], respectively, for F105W, F140W, and F160W.
KMOS IFU data. Observations in YJ (spectral coverage: 1.0251.344 μm) and H (spectral coverage: 1.4561.846 μm) bands were obtained in 2013 (Program ID: 092.A0114(A), PI: R. Fassbender). In the present study we analyze the KMOS data centered on the X-ray source 3 (RA = 0:44:05.4570; Dec = −20:34:16.672) with a 2.8″ × 2.8″ field of view (see the magenta square in the right panel of Fig. 1), for a total target integration time of ∼4.4 h in YJ band and ∼1.25 h in H band. At the redshift of the cluster (i.e., z ∼ 1.6), YJ band samples the [OIII] and Hβ emission lines with a resolving power R = 3600 while H band samples the Hα region with R = 4000. The data have been reduced using the pipeline with the Software Package for Astronomical Reduction with KMOS (SPARK; Davies et al. 2013), which includes dark correction, flat fielding, illumination correction, wavelength calibration and sky subtraction (Davies et al. 2011). The data were then combined according to the spatial shift of the objects in each frame.
Chandra X-ray data. The data used for the X-ray spectral analysis were obtained from six different observations performed in September, October, and November 2013 (PI: P. Tozzi) with the ACIS-S instrument of the Chandra observatory for 370 ks of exposure time. We consider X-ray data in the energy range 0.3−7.0 keV, where the Chandra ACIS detector is most sensitive and well calibrated. Details on observations and data reduction can be found in Tozzi et al. (2014).
3. Data analysis
3.1. NIR source identification and photometry
We focus our photometric analysis on the 24 kpc × 24 kpc region observed by HST (see right panel of Fig. 1). A ground-based (HAWK-I J and Ks bands and Subaru/Suprime V and i bands) photometric analysis in this region was performed by Fassbender et al. (2014) and Santos et al. (2015) who identified three different sources, labeled ‘A’, ‘C’, and ‘D’ in Fig. 1 (right panel), in addition to the previously discovered spectroscopic member B (Santos et al. 2011).
Thanks to the higher resolution, HST images allow us to distinguish more sources compared to ground-based images. We used SExtractor (Bertin & Arnouts 1996) to detect and deblend the sources, identifying a total of nine objects. As shown in the right panel of Fig. 1, sources A and B identified with HAWK-I each consist of three different objects, that is, m1+m2+m3 and n1+n2+n3, respectively. Moreover, an additional faint source (Q) was detected only in HST data.
The photometric analysis was performed using A-PHOT (Merlin et al. 2019). We tried to estimate the flux contamination from neighboring sources by taking two different photometric measurements. Photometric values are first obtained within elliptical apertures defined by eye to include most of the visible light coming from each galaxy (APER); these are then converted into magnitudes in the F105W, F140W, and F160W bands using zp = 26.2, 26.4, and 25.9, respectively, as zero points1. A second photometric measurement is obtained simply considering the fluxes assigned to each galaxy in the segmentation map created by SExtractor (ISO). We consider the difference between the two measurements as a reasonable approximation of the contamination between sources. Final uncertainties are computed as the combination of the statistical error provided by A-PHOT and the contamination uncertainty. We find that, given the extremely crowded region, the final errors are dominated by contamination. The derived HST F105W-, F140W-, and F160W-band AB system magnitudes together with the associated errors and the HST coordinates (RA and Dec) are reported in Table 1.
3.2. Near-infrared spectroscopy
Here we present our spectroscopic analysis of the sources identified with the HST. Spectra in YJ- and H-band were extracted at the position of the sources identified by the HST using a fixed aperture of 3 pixels (i.e., 0.6″) in diameter on the KMOS data cubes. In the H-band spectrum of six out of the nine sources we found individual emission lines with S/N ranging from ∼3 to ∼10. As these sources belong to a crowded region, it is reasonable to assume that they are physically close to each other, that is, that they are at a similar redshift. Moreover, as these complexes are within a galaxy cluster, we can guess that the redshift of the galaxies is approximately similar to the average cluster redshift. Therefore, we assume that these lines represent Hα transitions, which is also one of the strongest lines expected. For two of them (m1 and n1), an Hβλ4861 Å line is also observed in the YJ-band spectrum, although we found these lines in a noisy region contaminated by the sky lines. A zoom onto the spectral region showing the Hα line for these sources is shown in Fig. 2, while the redshifts derived by fitting the observed lines are listed in Table 2 together with the FWHM of the line and the S/N calculated as the ratio between the signal at the peak of the narrow Hα emission line and the σ of the signal in the spectrum where there is only the continuum.
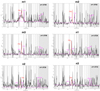 |
Fig. 2. Zoom onto the H-band spectra around the Hα line of the six confirmed cluster members. The red line shows the power-law+Gaussian fit of the emission line, while the magenta line is used to mark the continuum and the [NII] and [SII] emission lines. The derived spectral properties are listed in Table 2. |
Results of the KMOS spectral analysis.
Redshifts range from z = 1.5728 to z = 1.5762 and, given the small dispersion (Δz = 0.0034), all six galaxies are therefore spectroscopically confirmed cluster members. Given the redshifts of the sources and their apparent position, we can identify two subgroups in the system: Complex M, which includes m1, m2, and m3, whose redshifts range from z = 1.5756 to z = 1.5762 (Δz = 0.0006), and Complex N, consisting of n1, n2, and n3 with z between 1.5728 and 1.5732 (Δz = 0.0004). We note that the redshift of source n3 is tentative given the low S/N of the line. Interestingly, the analysis of the spectrum of source m1 shows that the Hα emission line is broad (FWHM > 1500 km s−1, see Fig. 2m1-panel). Source m1 is therefore classified as a broad-line AGN (BLAGN, see Sect. 4 for more details). Finally, from the analysis of the YJ-band spectra, an Hβλ4861 Å line is observed for sources m1 and n1, confirming their redshift (see Fig. 3).
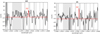 |
Fig. 3. Zoom onto the YJ-band spectra around the Hβ line respectively for sources m1 and n1. |
For all six galaxies for which a redshift has been measured, we estimate the rest-frame luminosity at 5100 Å (L5100 Å) and the V-band absolute magnitude from the flux measured at the wavelength of interest by interpolating the HST photometric points in F105W and F140W bands. These values are listed in Table 2.
3.3. Kinematic analysis of the super complex of galaxies
XDCP0044 shows a complex dynamical state. Some evidence of this particular state is the presence of diffuse emission between galaxies. Therefore, we searched for emission lines at the same redshift as the analyzed system. The IFU data in particular allow us to perform a spatially resolved study of the kinematics of the Hα emission line.
As a first step, we created a velocity shift map of the narrow Hα emission line relative to source m1 to identify patterns of gas and galaxies. We chose source m1 because it is an AGN (see Sect. 4) and is therefore the best candidate to be the most massive galaxy and the gravitational center of the system. We estimated the velocity shifts for each galaxy considering source m1 as reference and following the relation by Harrison (1974):
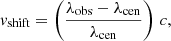 (1)
(1)
where λobs is the observed wavelength of the narrow Hα emission line in a given source, while λcen is the wavelength corresponding to the Hα emission line of source m1. Figure 4 shows a map in which different colors indicate the velocity shift of each source with respect to source m1. This map was obtained by extracting the total emission of narrow and broad Hα emission lines for each source considering the regions used for photometric analysis (see Sect. 3.1). We then studied the dynamics of the diffuse emission by looking at the narrow Hα emission line pixel by pixel, excluding the broad Hα emission line (see Fig. 5). The S/N cut of this map is ∼2.5.
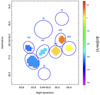 |
Fig. 4. Velocity shift map of the individual sources, with respect to m1. Blue circles mark the sources detected with the HST. |
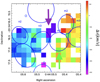 |
Fig. 5. Velocity shift map of the narrow Hα emission line. Green and purple arrows mark the Hα extended emission detected outside the main sources. |
Visual inspection of the maps clearly confirms that sources m1, m2, and m3 belong to the same complex of galaxies (Complex M), while sources n1, n2, and n3 belong to Complex N, and have a negative velocity shift (∼300 km s−1) with respect to Complex M. Given the small velocity difference, Complex M and Complex N are expected to undergo separate mergers to form two more massive galaxies. Eventually, Complex M and Complex N may also merge with each other, finally forming a second BCG, as anticipated by the analysis of Fassbender et al. (2014). These results are further discussed in Sect. 5.1.
We then focus on a region located south of source m1, where we identify diffuse emission at the same wavelength as the narrow Hα emission line of m1, which is also visible in the HST IR images. In addition, we find diffuse emission between sources m1 and n3, with a very high velocity shift (∼450 km s−1), although the detection has a low significance. Both detections can be interpreted as diffuse gas between galaxies, destabilized by recent galaxy–galaxy encounters. In the case of the Hα emission below source m1, this could also be interpreted as an extended (∼7 kpc) narrow line region (ENLR) around source m1 (see e.g., Hippelein et al. 1996; Husemann et al. 2019). We do not discuss the diffuse emission further, arguing that deeper IR integral field spectroscopy may reveal the dynamics of the diffuse baryons in the dense cluster core in greater detail, which will help in tracing the complex dynamical interaction occurring during the merger phase.
4. Analysis of the source m1
4.1. X-ray spectroscopy of m1
As discussed in Sect. 3.2, the source m1 is identified as a BLAGN and has been detected as a point-like source in the Chandra image by Tozzi et al. (2014). Here, we present a detailed spectral analysis of the Chandra data for m1. The source+background spectrum was extracted from a circular region of radius ∼1 arcsec centered on source m1, within which we measure  net counts in the 0.3−7 keV band. The background spectrum (rescaled to the extraction area and subtracted to the source+background spectrum) was extracted from an annular region with inner and outer radii of 4 and 10 arcsec, respectively. The data from these six observations (see Sect. 2) are combined to form a single spectrum using the FTOOLS script addascaspec. The spectra were binned so that there was at least one count per bin and modeled using the software XSPEC v. 12.12.0 in the [0.3−7.0 keV] band. Also, we performed the analysis using Cash statistics (Cash 1979). The rebinned spectrum is shown in Fig. 6.
 |
Fig. 6. Chandra X-ray spectrum of m1 with the best-fit model (red line). The lower panel shows the residuals. |
To fit the spectrum we used a model that includes three terms: a power law, which models the emission related to the Comptonization of photons from the hot electron corona surrounding the accretion disk, a term that accounts for the Galactic absorption, and a term for the intrinsic absorption. The results show that the photon index Γ is between 1.8 and 2.0, typical range for Type-1 AGNs, and that the source is moderately obscured (![Mathematical equation: $ \mathrm{Log}[N_{\mathrm{H}}/\mathrm{cm^{2}}] = 22.4^{+0.2}_{-0.5} $](/articles/aa/full_html/2022/12/aa44078-22/aa44078-22-eq3.gif) ), assuming a Galactic column density fixed at Log[NH/cm2] = 20.1 (HI4PI Collaboration 2016). The X-ray properties of the source m1 are reported in Table 3. From the derived values, and assuming a redshift of 1.5758 (see Sect. 3.2), the intrinsic, unabsorbed luminosity is measured to be
), assuming a Galactic column density fixed at Log[NH/cm2] = 20.1 (HI4PI Collaboration 2016). The X-ray properties of the source m1 are reported in Table 3. From the derived values, and assuming a redshift of 1.5758 (see Sect. 3.2), the intrinsic, unabsorbed luminosity is measured to be ![Mathematical equation: $ \mathrm{Log}[L_\mathrm{[2{-}10\,keV]}^{\mathrm{X}}] = 43.4^{+0.3}_{-0.4} $](/articles/aa/full_html/2022/12/aa44078-22/aa44078-22-eq4.gif) in the [2−10 keV] rest-frame band. These results are consistent within 1σ with those found in Tozzi et al. (2014), where an aperture of 1.5 arcsec is used for the extraction of the spectrum.
in the [2−10 keV] rest-frame band. These results are consistent within 1σ with those found in Tozzi et al. (2014), where an aperture of 1.5 arcsec is used for the extraction of the spectrum.
Physical properties of the source m1.
In order to look for possible variability in flux, slope, and absorption during the three-month period of observations, we considered the three spectra separately, which we obtained by merging the corresponding Obsid in three different periods, and jointly modeled them. In this case, the model used to fit the spectra is the same as in the case of a single spectrum with the addition of a constant that takes into account possible changes in the source flux. We find that the signal in each temporal bin is too low to search for spectral variability, but by focusing on the flux normalization we found no hint of variability.
4.2. Bolometric luminosity, black hole mass, and Eddington ratio
From the 5100 Å luminosity, we derived the bolometric luminosity using the relation
 (2)
(2)
where K5100 Å is the bolometric correction given by Krawczyk et al. (2013; see also Saccheo et al. 2022). Considering K5100 Å = 4.33 ± 1.29, the value obtained for source m1 is ![Mathematical equation: $ \mathrm{Log}[L_{\mathrm{bol}}/\mathrm{erg\,s^{-1}}] = 44.49^{+0.11}_{-0.15} $](/articles/aa/full_html/2022/12/aa44078-22/aa44078-22-eq10.gif) .
.
It is also possible to compute the bolometric luminosity using the X-ray luminosity at [2−10 keV] band and assuming the bolometric corrections by Duras et al. (2020):
![Mathematical equation: $$ \begin{aligned} K_{\rm X}(\mathrm{Bol}) = \frac{L_{\rm bol}}{L_{\rm X}} = a \left[1+\left(\frac{\log (L_{\rm bol}/L_{\odot })}{b}\right)^{c}\right], \end{aligned} $$](/articles/aa/full_html/2022/12/aa44078-22/aa44078-22-eq11.gif) (3)
(3)
with a = 12.76 ± 0.13, b = 12.15 ± 0.01, and c = 18.78 ± 0.14 as in Table 1 of Duras et al. (2020) for Type-1 AGNs. The value obtained for source m1 is ![Mathematical equation: $ \mathrm{Log}[L_{\mathrm{bol}}^{\mathrm{X}}/\mathrm{erg\,s^{-1}}] \sim 44.52 $](/articles/aa/full_html/2022/12/aa44078-22/aa44078-22-eq12.gif) , in agreement with that obtained from the 5100 Å luminosity above. Given the nuclear origin of the AGN X-ray emission, such agreement bolsters our certainty that the 5100 Å luminosity is not contaminated by the host galaxy.
, in agreement with that obtained from the 5100 Å luminosity above. Given the nuclear origin of the AGN X-ray emission, such agreement bolsters our certainty that the 5100 Å luminosity is not contaminated by the host galaxy.
We then estimated the BH mass of m1 using the virial formula applied to the BLRs. In particular, as we detected a broad Hα emission line in the spectrum of m1, we used the relation found by Greene & Ho (2005), which utilizes the FWHM and the luminosity of the broad Hα emission line according to the relation:
 (4)
(4)
Using the values of FWHMHα and LHα from Table 2, we derived the mass of the central BH which is Log[MBH/M⊙] = 7.15 ± 0.32. As a further check, we computed the BH mass using, together with the FWHM of the broad Hα emission line, the absorption corrected [2−10 keV] X-ray luminosity as in Eq. (4) of Bongiorno et al. (2014):
![Mathematical equation: $$ \begin{aligned} \log M_{\rm BH} = 7.11 + 2.06 \log \frac{FWHM_{\rm H\alpha }}{10^{3}\,\mathrm{km\,s^{-1}}} + 0.693 \log \frac{L_{[2{-}10\,\mathrm{keV}]}}{10^{44}\,\mathrm{erg\,s^{-1}}}\cdot \end{aligned} $$](/articles/aa/full_html/2022/12/aa44078-22/aa44078-22-eq14.gif) (5)
(5)
The obtained value is ![Mathematical equation: $ \mathrm{Log}[M_{\mathrm{BH}}/M_{\odot}] = 7.08^{+0.40}_{-0.45} $](/articles/aa/full_html/2022/12/aa44078-22/aa44078-22-eq15.gif) , which is consistent with the value found above.
, which is consistent with the value found above.
The error associated to the BH masses is given by the sum of the statistical and systematic uncertainties. The systematic uncertainty in the Log MBH determination was estimated as 0.3 dex to account for the observed scatter in the virial relation itself, while in the computation of the statistical errors, we take into account the errors in the 5100 Å and X-ray luminosity, and the error on the FWHM measurement (in quadrature).
Furthermore, from the central BH mass it is possible to calculate the Eddington luminosity, which is linked only to the mass of the body that is accreting according to the relation
![Mathematical equation: $$ \begin{aligned} L_{\rm Edd} = 1.33 \times 10^{38} \left(\frac{M}{M_{\odot }}\right) \, [\mathrm{erg\,s^{-1}}]. \end{aligned} $$](/articles/aa/full_html/2022/12/aa44078-22/aa44078-22-eq16.gif) (6)
(6)
Assuming Log[MBH/M⊙] = 7.15 ± 0.32 ( ), the Eddington luminosity of source m1 is Log[LEdd/erg s−1] = 45.28 ± 0.32 (
 ). Finally, we calculated the Eddington ratio
 (7)
(7)
which describes the rate at which the central supermassive black hole (SMBH) is accreting. We obtain a value in the range λEdd ∼ 0.17–0.20. Therefore, we conclude that source m1 hosts a relatively small (∼107 M⊙) and moderately accreting (λEdd ∼ 0.2) SMBH. Its physical properties are summarized in Table 3.
5. Discussion
5.1. Mass assembly and timescales
Models and simulations (De Lucia & Blaizot 2007) predict that the mass of the galaxy population observed in clusters in the local Universe began to assemble at z ∼ 3 − 5. At z ∼ 2.5 the progenitors of massive galaxies started to form and at z ∼ 1 − 2 merger activity reached a peak. Then, the mass assembly proceeded through minor merging processes, leading to the formation of the galaxies observed in the local Universe.
As we previously mentioned, z ∼ 1.6 is a crucial epoch in the study of mass assembly because it is close to the SF and BH activity peak (Madau & Dickinson 2014). The region of 24 kpc × 24 kpc analyzed in this work includes a super complex formed by between six and nine interacting galaxies, making it an extraordinarily dense region. The surface number density is measured to be ∼10−2 kpc−2 in physical units. This can be seen as a lower limit, considering that we find nine sources identified in HST images. This region is denser than the core region of XDCP0044 (Travascio et al. 2020), which shows a surface number density of one order of magnitude lower, and is also even denser than the core region of the Spiderweb protocluster at z ∼ 2.156 (Roettgering et al. 1994; Pentericci et al. 1997; Miley et al. 2006), which shows a surface number density of ∼7 × 10⁻⁴ kpc−2 (Kuiper et al. 2011).
Furthermore, the six confirmed cluster members form two different complexes, Complex M and Complex N, which are located at a distance of d ∼ 13 kpc and have a relative velocity of v ∼ 300 − 400 km s−1. Simulations show that most pairs of galaxies of sufficient proximity to one another, that is, typically 20−30 kpc, and with a sufficiently low velocity difference (∼200−300 km s−1) will eventually merge on a short timescale (e.g., Patton et al. 2002; López-Sanjuan et al. 2011, 2012). Indeed, the six to nine interacting galaxies in the analyzed region will likely merge within a timescale comparable to dynamical friction (Conselice 2014).
It is also possible to estimate the collision timescale among the sources in Complex M and sources in Complex N that are considered pairs of galaxies in a dense environment. To estimate this timescale, we first computed the stellar mass of each galaxy resolved by HST images by performing an SED-fitting procedure on HST photometry, HAWK I, J, and Ks bands, and Subaru/Suprime V and i bands. We used the Z-PHOT code (Fontana et al. 2000) with Bruzual & Charlot (2003) templates, Salpeter (1955) initial mass function, and Calzetti et al. (2000) extinction. We adopted exponentially declining SF histories (τ-models). However, for the detected sources n1, n2, and n3, the accuracy on photometry is not sufficient to constrain the SED, and therefore we derived their masses assuming different values of mass-to-light ratio, according to different population models (McGaugh & Schombert 2014). Mass values and their associated uncertainties are listed in Table 4. Finally, we estimated the radius of the sources as the half-light radius obtained with SExtractor (Bertin & Arnouts 1996). The best-fitting masses of the sources in the analyzed region sum up to a total stellar mass of ∼1011 M⊙.
Values of mass, with upper and lower limits, for the six sources in the KMOS field of view.
We then used the relation reported by Vijayaraghavan & Ricker (2013) to calculate the collision timescale:
 (8)
(8)
where ngal is the number density of galaxies in the analyzed region –in our case we considered the cluster members detected in the KMOS field of view in a sphere with radius of ∼12 kpc (half of the KMOS field of view)– and σcs is the galaxy cross-section calculated as
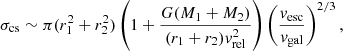 (9)
(9)
where Mi and ri are the mass and radius of the galaxy pair and vesc the escape velocity from the system. Finally, vgal is the velocity shift between the sources. The resulting merging time is of the order of ∼10 Myr for sources in Complex M and ∼30 Myr for sources in Complex N. If we use the same approach to estimate the merging time between Complex M and Complex N, we obtain an estimate of ∼370 Myr for these two complexes to form a single source.
5.2. Nuclear and star formation activity
One of the results of this work is the presence of an AGN in a very dense (∼4.9 × 10⁸ M⊙ kpc−2) and star-forming (SFR = 825 ± 120 M⊙ yr−1, see Sect. 1) region at ∼157 kpc from the core of a galaxy cluster at z > 1.5. The properties of this AGN are relevant to the AGN–host galaxy co-evolution scenario. According to Martini et al. (2009), Alberts et al. (2016), Bufanda et al. (2017) and others, the presence of an AGN in a galaxy cluster is directly correlated with the presence of gas-rich galaxies that, through merging, influence the transportation of molecular gas and consequently the AGN activity. The high SFR measured implies a large quantity of molecular gas surrounding the system. The availability of this inflowing gas means that, in turn, there are conditions for triggering BH accretion and at the same time sustaining the vigorous SF itself. Clearly, the dense environment favors SFG mergers and thus again accelerates both SF and nuclear activity (Ellingson & Yee 1993).
The AGN at the center of the studied region appears to be moderately obscured (Log[NH/cm2] ∼ 22), hosting a medium-sized (MBH ∼ 107 M⊙) and moderately accreting (λEdd ∼ 0.2) BH (see Sect. 4.1), providing a luminosity of Log[LX/erg s−1] ∼ 43. Following the evolutionary models of Sanders et al. (1988) and Hopkins et al. (2006), this represents a specific phase in the AGN–galaxy co-evolution. In these models, gas cools during galaxy mergers and falls onto the central BH, feeding its accretion and SF in the host galaxy. During this phase, the central BH is obscured by gas and dust. After all the gas is consumed or displaced by nuclear and stellar feedback, the AGN luminosity and star formation episodes decrease. In particular, the AGN studied in this work may be in the early stages of accretion. During this phase, we find a high SFR, which is due to the presence of cold gas, which is also feeding the central BH. According to this scenario, the AGN will continue to accrete gas from the environment and host galaxy, increasing its mass until, at some point, it will reach a critical mass and enter the feedback phase, beginning to emit winds and outflows. These winds and outflows eventually quench the SF in the host galaxy, driving it to develop into a red and passive galaxy, meaning a possible second BCG located south of the cluster core.
5.3. XDCP0044: a double merging cluster
From the analysis of the surface brightness distribution of XDCP0044, Tozzi et al. (2014) found that this cluster shows the presence of two clumps (see Fig. 7 left panel, magenta circles) with possibly different temperatures: the north clump with  keV and the south clump with
  keV, which are consistent at slightly less than 2σ. To confirm the presence of two different clumps, we analyzed the Chandra X-ray images with the Sherpa software in ciao.
 |
Fig. 7. Left Panel: AGN-subtracted Chandra X-ray image of XDCP0044. The magenta circles represent the north clump and south clump identified in Tozzi et al. (2014) with two different temperatures and the cyan crosses represent the four complexes identified in this cluster, Complex A and Complex B (Travascio et al. 2020) in the north and Complex M and Complex N in the south. The green crosses represent the X-ray emission peaks found with Sherpa image fitting. Central Panel: best-fit model obtained with Sherpa of the AGN-subtracted X-ray image. Right Panel: residuals obtained with Sherpa. |
We consider the AGN-subtracted Chandra X-ray image in the soft band and fit the data in this region with a double two-dimensional beta model plus background using the Cash statistic in order to find the emission peak of each clump. We find that the first peak is associated with the cluster core studied by Travascio et al. (2020; north clump), while the second peak is located south of the cluster core, shifted with respect to the region studied in this work, as shown in Fig. 7 (green and cyan crosses, respectively, in the left panel). To better understand the results obtained from the analysis, we show the best-fit model and the residuals obtained with Sherpa in Fig. 7 (central panel and right panel, respectively). We inspect the residuals and the S/N map of the residuals to search for possible structure in the X-ray emission not accounted for by our double beta model. We do not find any significant residuals, except for a weak hint of a slightly brighter arc in the overlapping region between the two clumps. This shows that the two-halo model is more than adequate for describing the data, and suggests that further signs of the ongoing merger should be investigated with future high-resolution X-ray missions such as Lynx (The Lynx Team 2018) and AXIS (Mushotzky & AXIS Team 2019; Marchesi et al. 2020).
In summary, we note that the main halo (hosting the core studied by Travascio et al. 2020) is significantly brighter and can be considered virialized with an almost fully formed BCG at the center. Moreover, we note that the southern clump has a lower surface brightness, and that its X-ray centroid is far from Complex M and Complex N. However, the position of the X-ray centroid of the weaker halo may have been biased by the low signal. Finally, we note another feature consisting in a weak but clearly visible extension toward the west, suggesting a very complex dynamical state that has not been modeled in the current analysis.
Despite the fact that our data set is not sufficient to provide a comprehensive explanation of the dynamical state of XDCP0044, we argue that we may be observing the merger of two halos, both recently virialized or in the process of being virialized, and each one with its own BCG in the assembly phase. We expect that the two systems identified in this work, Complex M and Complex N, will merge within ∼370 Myr to form a massive galaxy (M* ∼ 1011 M⊙). Following the same procedure applied in Sect. 5.1, we suggest that these complexes will eventually join the massive galaxy formed by Complex A and Complex B in the core (Travascio et al. 2020) on a timescale of ∼6 Gyr, which is in agreement with simulations (Boylan-Kolchin et al. 2008; Villalobos et al. 2013).
6. Summary and conclusions
Dense regions in high-z galaxy clusters are ideal laboratories for investigating the interplay between galaxies, nuclear activity, and the intergalactic gas. In particular, we analyzed high-resolution multi-band HST images, NIR IFU KMOS spectroscopic data, and the X-ray Chandra data for a small (24 kpc × 24 kpc) but very dense region around one of the X-ray point-like sources discovered within the galaxy cluster XDCP0044 at z ∼ 1.6, located ∼157 kpc from its center. The main results of this paper can be summarized as follows:
-
Thanks to the high-resolution HST data, we find that the analyzed region is denser than expected from the analysis of ground-based observations. In particular, up to nine sources have been detected in only 24 kpc × 24 kpc. This is even denser than the core of the cluster as measured by Travascio et al. (2020) and the core of the Spiderweb protocluster at z ∼ 2.156. We performed a photometric analysis using all the available HST bands, that is, F105W, F140W, and F160W, and computed the fluxes and magnitudes of the nine identified sources. These values were then used to compute the monochromatic luminosities at 5100 Å.
-
From the KMOS IFU spectroscopic analysis, we found that at least six of the nine sources detected in HST show a narrow Hα emission line, and that two of them also show the Hβ emission line. From the derived redshifts, which range from 1.5728 to 1.5762, we find that all six sources are confirmed cluster members. Moreover, the sources seem to be located in two different subgroups: Complex M and Complex N at a projected distance of d ∼ 13 kpc. Complex M is formed by sources m1, m2, and m3, with redshift ranging from 1.5756 to 1.5762, and Complex N by sources n1, n2, and n3, with redshift ranging from 1.5728 to 1.5732.
-
IFU spectroscopic data allow us to study the kinematics of the analyzed complexes through velocity-shift maps of the narrow Hα emission line. From such maps, we find that Complex N has a negative velocity shift (∼300 km s−1) with respect to Complex M. Moreover, these maps reveal significant emission below source m1 at the same wavelength as the narrow Hα emission line of m1 that can be interpreted as either diffuse gas in between galaxies, which could be gas stripped during the merger, or an ENLR around source m1. We also find hints of emission between the sources m1 and n3 with a high velocity shift (∼450 km s−1).
-
From the Chandra X-ray spectrum of source m1, we find a photon index of between 1.8 and 2.0, which is the typical range found for AGNs, and an obscuration of NH ∼ 1022 cm−2 for an intrinsic X-ray luminosity of L[2 − 10] keV ∼ 1043 erg s−1. We detected a broad Hα emission line in the spectrum of source m1. This source is therefore classified as a BLAGN. By applying the virial formula, using the measured HαFWHM > 1500 km s−1 and luminosity, we estimate a SMBH mass of MBH ∼ 107 M⊙.
-
The 5100 Å luminosity of the six confirmed cluster members was derived by interpolating the computed HST fluxes at F105W and F140W. Source m1, with Log[L5100 Å/erg s−1] ∼ 43.85, is the most powerful source, in agreement with the fact that it hosts an AGN. Moreover, by applying the AGN bolometric corrections by Krawczyk et al. (2013) to m1, we estimated the bolometric luminosity using L5100 Å, finding Log[Lbol/erg s−1] ∼ 44.49. This value is in agreement with what is found by applying the bolometric corrections by Duras et al. (2020) to the X-ray [2−10] keV luminosity, confirming that the monochromatic luminosity at 5100 Å is related to a nuclear component.
-
Finally, from the BH mass and the bolometric luminosity, we derived the Eddington luminosity, Log[LEdd/erg s−1] ∼ 45.2, and a relatively high Eddington ratio λEdd ∼ 0.2.
-
While the merger timescale is estimated to be 10 Myr for Complex M and 30 Myr for Complex N, the two complexes, at a distance of ∼13 kpc with a velocity shift of ∼300 km s−1, will likely merge within a timescale comparable to dynamical friction to form a massive galaxy, possibly the second BCG of XDCP0044.
-
After a revised analysis of the X-ray image of XDCP0044, we conclude that the two complex pairs (A+B, Travascio et al. 2020, and M+N) are most likely associated to two merging halos with different properties in terms of average ICM temperature and surface brightness.
In summary, we investigated a region in the high-redshift galaxy cluster XDCP0044. Our results suggest that it is probably the formation site of one of the two BCGs of the cluster that is undergoing a major merger. These results corroborate a scenario in which AGN activity is triggered during the mergers between gas-rich galaxies, which provide the fuel for both the AGN and the starburst activity. Given the high BH accretion rate and the high SFR, the BH is expected to rapidly increase its mass during the galaxy merger and later, through feedback, to quench the SF, leading to the formation of a massive and passive galaxy, as observed in local galaxy clusters. Deeper IR integral field spectroscopy may provide further insights into the dynamical state of the galaxy systems, and help in constraining their future evolution. Regarding the hot, diffuse baryons, the loss of sensitivity of the only arcsec resolution X-ray facility (Chandra) makes it impossible to go deeper in the X-ray band. However, high-resolution imaging of the SZ effect due to the ICM itself may be obtained thanks to ALMA. Also, thanks to the advent of JWST, detailed studies of the assembling galaxies in high-z clusters will become more frequent, allowing us to reach a comprehensive description of a crucial phase in the formation and evolution of massive galaxies.
Acknowledgments
We thank G. De Lucia and E. Rasia for useful discussions, and the anonymous referee for the accurate comments on the paper.
References
- Aarseth, S., & Fall, S. 1980, ApJ, 236, 43 [NASA ADS] [CrossRef] [Google Scholar]
- Alberts, S., Pope, A., Brodwin, M., et al. 2014, MNRAS, 437, 437 [NASA ADS] [CrossRef] [Google Scholar]
- Alberts, S., Pope, A., Brodwin, M., et al. 2016, ApJ, 825, 72 [NASA ADS] [CrossRef] [Google Scholar]
- Balogh, M. L., Navarro, J. F., & Morris, S. L. 2000, ApJ, 540, 113 [Google Scholar]
- Bell, E. F., Wolf, C., Meisenheimer, K., et al. 2004, ApJ, 608, 752 [NASA ADS] [CrossRef] [Google Scholar]
- Bertin, E., & Arnouts, S. 1996, A&A, 117, 393 [Google Scholar]
- Bond, J., Cole, S., Efstathiou, G., & Kaiser, N. 1991, ApJ, 379, 440 [NASA ADS] [CrossRef] [Google Scholar]
- Bongiorno, A., Maiolino, R., Brusa, M., et al. 2014, MNRAS, 443, 2077 [NASA ADS] [CrossRef] [Google Scholar]
- Boylan-Kolchin, M., Ma, C.-P., & Quataert, E. 2008, MNRAS, 383, 93 [Google Scholar]
- Brodwin, M., Stanford, S., Gonzalez, A. H., et al. 2013, ApJ, 779, 138 [NASA ADS] [CrossRef] [Google Scholar]
- Bruzual, G., & Charlot, S. 2003, MNRAS, 344, 1000 [NASA ADS] [CrossRef] [Google Scholar]
- Bufanda, E., Hollowood, D., Jeltema, T. E., et al. 2017, MNRAS, 465, 2531 [NASA ADS] [CrossRef] [Google Scholar]
- Calzetti, D., Armus, L., Bohlin, R. C., et al. 2000, ApJ, 533, 682 [NASA ADS] [CrossRef] [Google Scholar]
- Cash, W. 1979, ApJ, 228, 939 [Google Scholar]
- Conselice, C. J. 2014, ARA&A, 52, 291 [CrossRef] [Google Scholar]
- Davies, R., Förster Schreiber, N., Cresci, G., et al. 2011, ApJ, 741, 69 [NASA ADS] [CrossRef] [Google Scholar]
- Davies, R., Berbel, A., Wiezorrek, E., et al. 2013, A&A, 558, A56 [NASA ADS] [CrossRef] [EDP Sciences] [Google Scholar]
- De Lucia, G., & Blaizot, J. 2007, MNRAS, 375, 2 [Google Scholar]
- Duras, F., Bongiorno, A., Ricci, F., et al. 2020, A&A, 636, A73 [NASA ADS] [CrossRef] [EDP Sciences] [Google Scholar]
- Ellingson, E., & Yee, H. K. C. 1993, in Evolution of Galaxies and their Environment, eds. J. Shull, & H. Thronson, 309 [Google Scholar]
- Fassbender, R., Böhringer, H., Nastasi, A., et al. 2011a, New J. Phys., 13, 125014 [Google Scholar]
- Fassbender, R., Nastasi, A., Böhringer, H., et al. 2011b, A&A, 527, L10 [NASA ADS] [CrossRef] [EDP Sciences] [Google Scholar]
- Fassbender, R., Nastasi, A., Santos, J. S., et al. 2014, A&A, 568, A5 [NASA ADS] [CrossRef] [EDP Sciences] [Google Scholar]
- Fontana, A., D’Odorico, S., Poli, F., et al. 2000, AJ, 120, 2206 [NASA ADS] [CrossRef] [Google Scholar]
- Galametz, M., Madden, S., Galliano, F., et al. 2009, A&A, 508, 645 [NASA ADS] [CrossRef] [EDP Sciences] [Google Scholar]
- Greene, J. E., & Ho, L. C. 2005, ApJ, 630, 122 [NASA ADS] [CrossRef] [Google Scholar]
- Gunn, J. E., & Gott, J. R., III 1972, ApJ, 176, 1 [Google Scholar]
- Harrison, E. 1974, ApJ, 191, L51 [NASA ADS] [CrossRef] [Google Scholar]
- HI4PI Collaboration (Ben Bekhti, N., et al.) 2016, A&A, 594, A116 [NASA ADS] [CrossRef] [EDP Sciences] [Google Scholar]
- Hilton, M., Lloyd-Davies, E., Stanford, S. A., et al. 2010, ApJ, 718, 133 [NASA ADS] [CrossRef] [Google Scholar]
- Hippelein, H., Meisenheimer, K., & Roeser, H. 1996, A&A, 316, 29 [NASA ADS] [Google Scholar]
- Hopkins, P. F., Hernquist, L., Cox, T. J., et al. 2006, ApJS, 163, 1 [Google Scholar]
- Husemann, B., Bennert, V. N., Jahnke, K., et al. 2019, ApJ, 879, 75 [Google Scholar]
- Krawczyk, C. M., Richards, G. T., Mehta, S. S., et al. 2013, ApJS, 206, 4 [Google Scholar]
- Kuiper, E., Hatch, N., Miley, G., et al. 2011, MNRAS, 415, 2245 [NASA ADS] [CrossRef] [Google Scholar]
- López-Sanjuan, C., Le Fèvre, O., de Ravel, L., et al. 2011, A&A, 530, A20 [Google Scholar]
- López-Sanjuan, C., Le Fèvre, O., Ilbert, O., et al. 2012, A&A, 548, A7 [Google Scholar]
- Madau, P., & Dickinson, M. 2014, ARA&A, 52, 415 [Google Scholar]
- Marchesi, S., Gilli, R., Lanzuisi, G., et al. 2020, A&A, 642, A184 [EDP Sciences] [Google Scholar]
- Martini, P., Sivakoff, G. R., & Mulchaey, J. S. 2009, ApJ, 701, 66 [Google Scholar]
- Martini, P., Miller, E., Brodwin, M., et al. 2013, ApJ, 768, 1 [NASA ADS] [CrossRef] [Google Scholar]
- McCarthy, I., Frenk, C., Font, A., et al. 2008, MNRAS, 383, 593 [NASA ADS] [CrossRef] [Google Scholar]
- McGaugh, S. S., & Schombert, J. M. 2014, AJ, 148, 77 [Google Scholar]
- Menanteau, F., González, J., Juin, J.-B., et al. 2010, ApJ, 723, 1523 [Google Scholar]
- Merlin, E., Pilo, S., Fontana, A., et al. 2019, A&A, 622, A169 [NASA ADS] [CrossRef] [EDP Sciences] [Google Scholar]
- Miley, G. K., Overzier, R. A., Zirm, A. W., et al. 2006, ApJ, 650, L29 [NASA ADS] [CrossRef] [Google Scholar]
- Moore, B., Katz, N., Lake, G., Dressler, A., & Oemler, A. 1996, Nat. Astron., 379, 613 [Google Scholar]
- Mushotzky, R., & AXIS Team 2019, in The Space Astrophysics Landscape for the 2020s and Beyond, eds. J. E. Moores, P. L. King, C. L. Smith, et al., LPI Contribution, 2135, 5025 [NASA ADS] [Google Scholar]
- Narayanan, D., Dey, A., Hayward, C. C., et al. 2010, MNRAS, 407, 1701 [Google Scholar]
- Park, C., & Hwang, H. S. 2009, ApJ, 699, 1595 [NASA ADS] [CrossRef] [Google Scholar]
- Patton, D., Pritchet, C., Carlberg, R., et al. 2002, ApJ, 565, 208 [CrossRef] [Google Scholar]
- Pentericci, L., Roettgering, H., Miley, G., Carilli, C., & McCarthy, P. 1997, A&A, 326, 580 [Google Scholar]
- Pimbblet, K., Shabala, S., Haines, C., Fraser-McKelvie, A., & Floyd, D. 2013, MNRAS, 429, 1827 [NASA ADS] [CrossRef] [Google Scholar]
- Roettgering, H., Lacy, M., Miley, G., Chambers, K., & Saunders, R. 1994, A&AS, 108, 79 [Google Scholar]
- Saccheo, I., Bongiorno, A., & Piconcelli, E. 2022, A&A, submitted [NASA ADS] [CrossRef] [EDP Sciences] [Google Scholar]
- Salpeter, E. E. 1955, ApJ, 121, 161 [Google Scholar]
- Sanders, D., Soifer, B., Elias, J., et al. 1988, ApJ, 325, 74 [NASA ADS] [CrossRef] [Google Scholar]
- Santos, J. S., Fassbender, R., Nastasi, A., et al. 2011, A&A, 531, L15 [NASA ADS] [CrossRef] [EDP Sciences] [Google Scholar]
- Santos, J. S., Altieri, B., Valtchanov, I., et al. 2015, MNRAS, 447, L65 [NASA ADS] [CrossRef] [Google Scholar]
- Tadaki, K.-I., Kodama, T., Ota, K., et al. 2012, MNRAS, 423, 2617 [CrossRef] [Google Scholar]
- The Lynx Team 2018, ArXiv e-prints [arXiv:1809.09642] [Google Scholar]
- Tozzi, P., Santos, J., Jee, J., et al. 2014, ApJ, 799, 93 [Google Scholar]
- Travascio, A., Bongiorno, A., Tozzi, P., et al. 2020, MNRAS, 498, 2719 [NASA ADS] [CrossRef] [Google Scholar]
- van den Bosch, F. C., Aquino, D., Yang, X., et al. 2008, MNRAS, 387, 79 [Google Scholar]
- Vijayaraghavan, R., & Ricker, P. 2013, MNRAS, 435, 2713 [NASA ADS] [CrossRef] [Google Scholar]
- Villalobos, A., De, L. G., Weinmann, S., Borgani, S., & Murante, G. 2013, MNRAS, 433, L49 [NASA ADS] [CrossRef] [Google Scholar]
- White, S., & Rees, M. 1978, MNRAS, 183, 341 [NASA ADS] [CrossRef] [Google Scholar]
- Williamson, R., Benson, B., High, F., et al. 2011, ApJ, 738, 139 [NASA ADS] [CrossRef] [Google Scholar]
- Wilson, G., Muzzin, A., Lacy, M., et al. 2006, ArXiv e-prints [arXiv:astro-ph/0604289] [Google Scholar]
All Tables
Values of mass, with upper and lower limits, for the six sources in the KMOS field of view.
All Figures
|
Fig. 1. HST images of XDCP0044 and the region analyzed in this work. Left Panel: adapted from Travascio et al. (2020): HST RGB (F105W + F104W + F160W) image of XDCP0044 with overlaid the soft ([0.5−2] keV) bands X-ray contours. The yellow circle is centered on the X-ray extended emission centroid (yellow cross, RA = 00:44:05.2 and Dec = −20:33:59.8) and has a radius of 30 arcsec, corresponding to ∼250 kpc. The red circles mark the 5 X-ray point-like sources detected by Tozzi et al. (2014). Right Panel: HST image in F105W band. The yellow circles mark the sources detected in ground based HAWK-I J and Ks bands by Fassbender et al. (2014) while cyan circles mark the sources detected in HST. The magenta square is the KMOS field of view. |
| In the text | |
|
Fig. 2. Zoom onto the H-band spectra around the Hα line of the six confirmed cluster members. The red line shows the power-law+Gaussian fit of the emission line, while the magenta line is used to mark the continuum and the [NII] and [SII] emission lines. The derived spectral properties are listed in Table 2. |
| In the text | |
|
Fig. 3. Zoom onto the YJ-band spectra around the Hβ line respectively for sources m1 and n1. |
| In the text | |
|
Fig. 4. Velocity shift map of the individual sources, with respect to m1. Blue circles mark the sources detected with the HST. |
| In the text | |
|
Fig. 5. Velocity shift map of the narrow Hα emission line. Green and purple arrows mark the Hα extended emission detected outside the main sources. |
| In the text | |
|
Fig. 6. Chandra X-ray spectrum of m1 with the best-fit model (red line). The lower panel shows the residuals. |
| In the text | |
|
Fig. 7. Left Panel: AGN-subtracted Chandra X-ray image of XDCP0044. The magenta circles represent the north clump and south clump identified in Tozzi et al. (2014) with two different temperatures and the cyan crosses represent the four complexes identified in this cluster, Complex A and Complex B (Travascio et al. 2020) in the north and Complex M and Complex N in the south. The green crosses represent the X-ray emission peaks found with Sherpa image fitting. Central Panel: best-fit model obtained with Sherpa of the AGN-subtracted X-ray image. Right Panel: residuals obtained with Sherpa. |
| In the text | |
Current usage metrics show cumulative count of Article Views (full-text article views including HTML views, PDF and ePub downloads, according to the available data) and Abstracts Views on Vision4Press platform.
Data correspond to usage on the plateform after 2015. The current usage metrics is available 48-96 hours after online publication and is updated daily on week days.
Initial download of the metrics may take a while.