Fig. 7.
Download original image
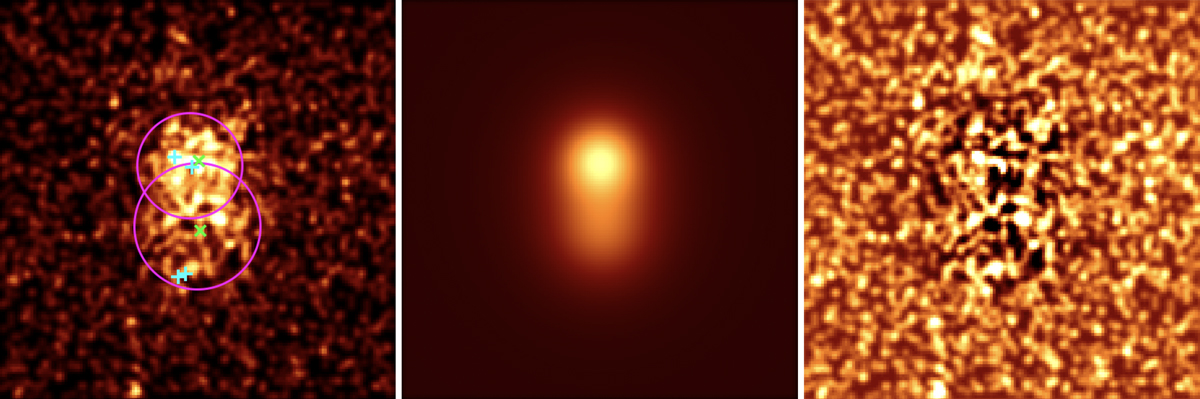
Left Panel: AGN-subtracted Chandra X-ray image of XDCP0044. The magenta circles represent the north clump and south clump identified in Tozzi et al. (2014) with two different temperatures and the cyan crosses represent the four complexes identified in this cluster, Complex A and Complex B (Travascio et al. 2020) in the north and Complex M and Complex N in the south. The green crosses represent the X-ray emission peaks found with Sherpa image fitting. Central Panel: best-fit model obtained with Sherpa of the AGN-subtracted X-ray image. Right Panel: residuals obtained with Sherpa.
Current usage metrics show cumulative count of Article Views (full-text article views including HTML views, PDF and ePub downloads, according to the available data) and Abstracts Views on Vision4Press platform.
Data correspond to usage on the plateform after 2015. The current usage metrics is available 48-96 hours after online publication and is updated daily on week days.
Initial download of the metrics may take a while.