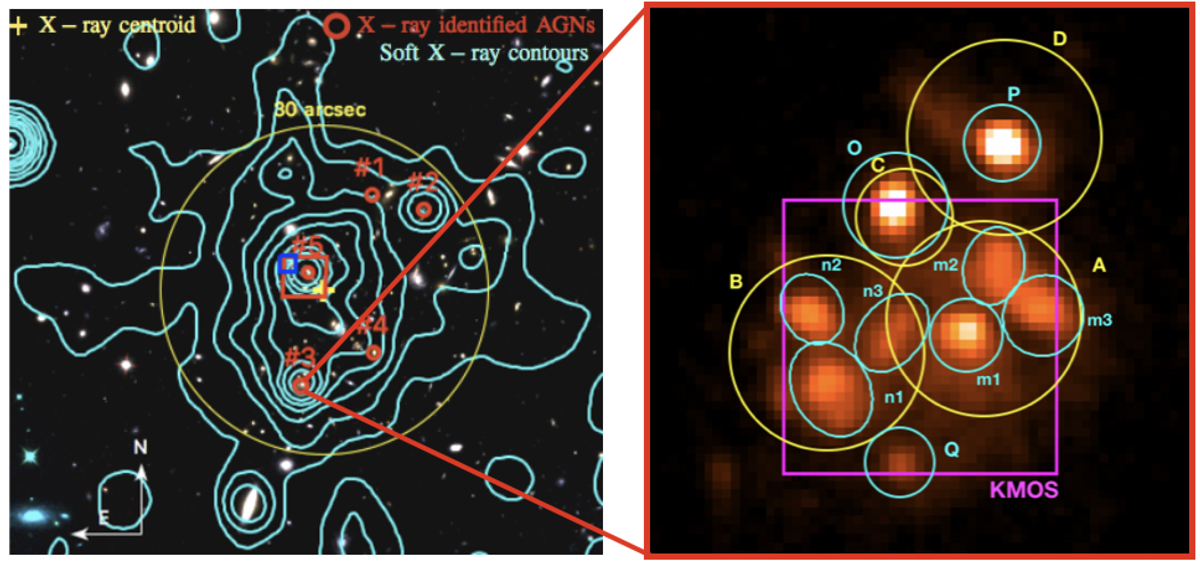
Fig. 1.
Download original image
HST images of XDCP0044 and the region analyzed in this work. Left Panel: adapted from Travascio et al. (2020): HST RGB (F105W + F104W + F160W) image of XDCP0044 with overlaid the soft ([0.5−2] keV) bands X-ray contours. The yellow circle is centered on the X-ray extended emission centroid (yellow cross, RA = 00:44:05.2 and Dec = −20:33:59.8) and has a radius of 30 arcsec, corresponding to ∼250 kpc. The red circles mark the 5 X-ray point-like sources detected by Tozzi et al. (2014). Right Panel: HST image in F105W band. The yellow circles mark the sources detected in ground based HAWK-I J and Ks bands by Fassbender et al. (2014) while cyan circles mark the sources detected in HST. The magenta square is the KMOS field of view.
Current usage metrics show cumulative count of Article Views (full-text article views including HTML views, PDF and ePub downloads, according to the available data) and Abstracts Views on Vision4Press platform.
Data correspond to usage on the plateform after 2015. The current usage metrics is available 48-96 hours after online publication and is updated daily on week days.
Initial download of the metrics may take a while.