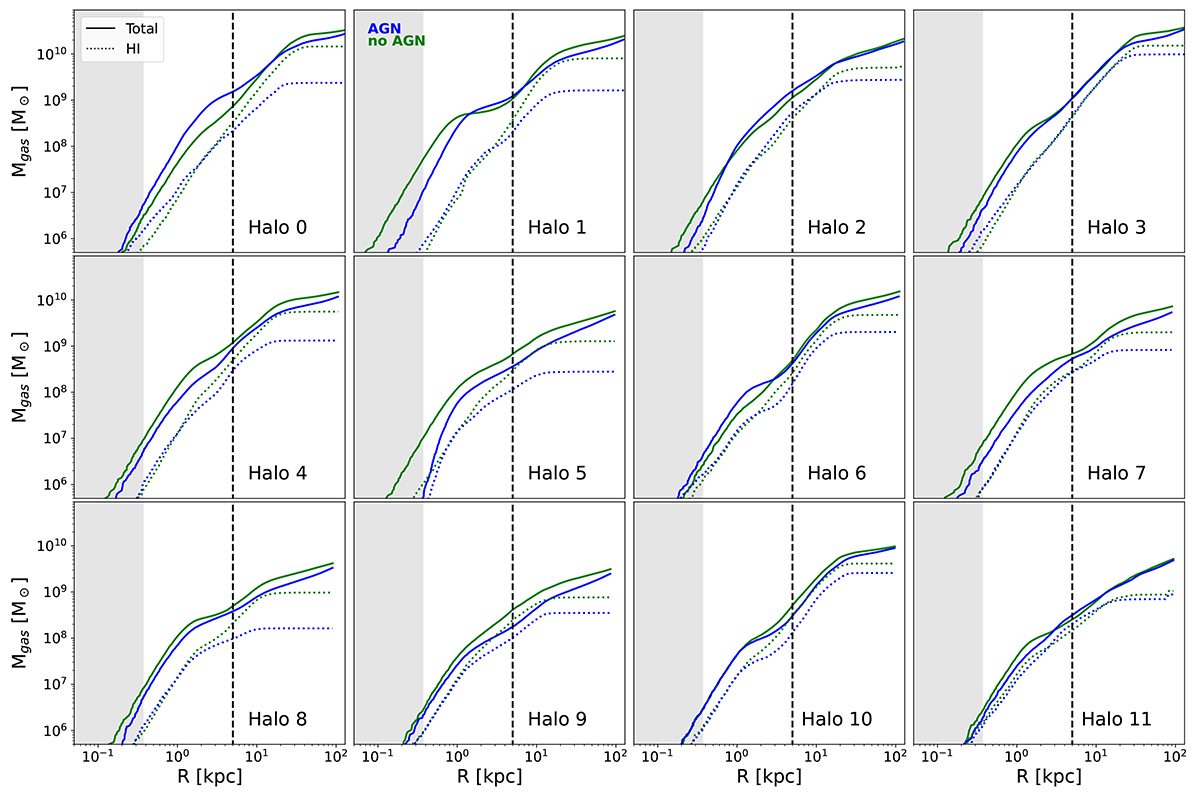
Fig. 10.
Download original image
Cumulative gas mass vs galactic radius, for the non-AGN configuration, in green, and the AGN one, in blue. Galaxies are ordered by increasing BH mass, from top left to bottom right. The total gas mass is shown as a solid line, and HI gas as a dotted line. The grey area indicates radii below the simulations’ physical softening length, while the vertical line highlights a radius of 5 kpc, to facilitate a comparison with the SFHs in the inner galaxy region shown in Fig. 5.
Current usage metrics show cumulative count of Article Views (full-text article views including HTML views, PDF and ePub downloads, according to the available data) and Abstracts Views on Vision4Press platform.
Data correspond to usage on the plateform after 2015. The current usage metrics is available 48-96 hours after online publication and is updated daily on week days.
Initial download of the metrics may take a while.