Fig. 9.
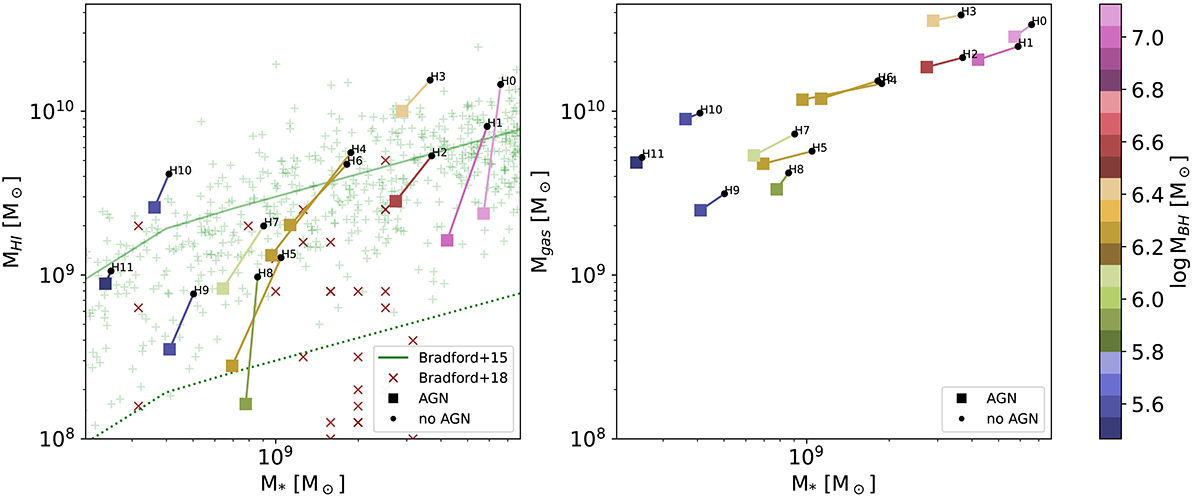
Download original image
Neutral hydrogen and gas mass vs stellar mass. Left-hand panel: Neutral hydrogen mass vs stellar mass, both quantities measured within the virial radius, for simulated dwarfs with (coloured squares) and without (black points) AGNs. Observational data of isolated dwarfs by Bradford et al. (2015) are shown as green crosses, while AGN candidates are indicated as red crosses, from Bradford et al. (2018). The solid green line represents the best fit of the Bradford et al. (2015) data, while the dotted green line is the threshold below which they define galaxies as being quenched. Right-hand panel: Total gas mass vs stellar mass for our set of simulated dwarf galaxies.
Current usage metrics show cumulative count of Article Views (full-text article views including HTML views, PDF and ePub downloads, according to the available data) and Abstracts Views on Vision4Press platform.
Data correspond to usage on the plateform after 2015. The current usage metrics is available 48-96 hours after online publication and is updated daily on week days.
Initial download of the metrics may take a while.