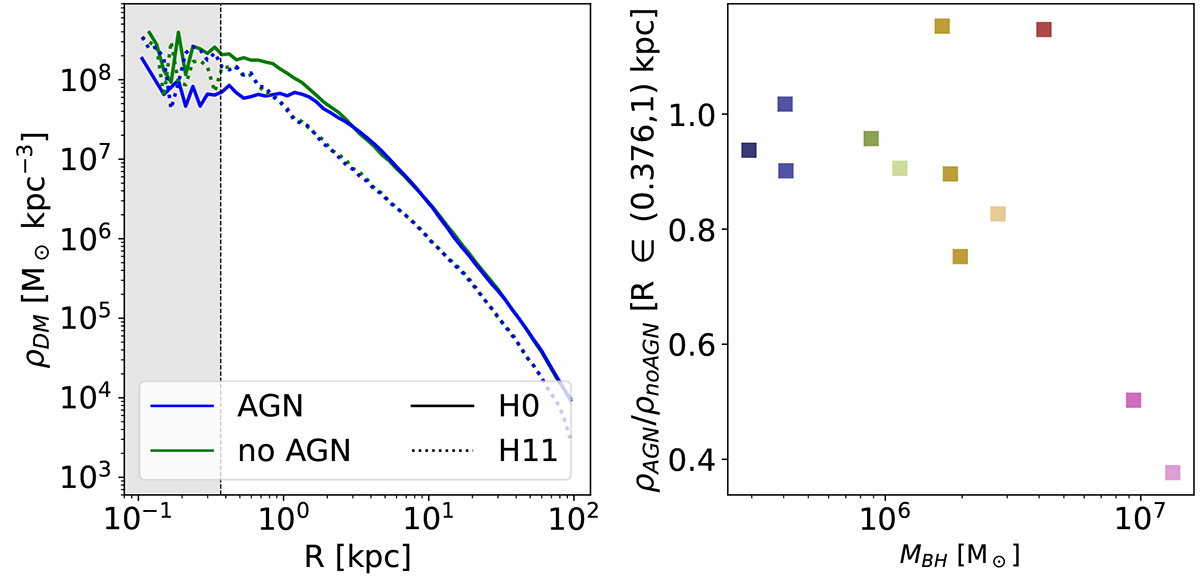
Fig. 8.
Download original image
DM profiles and inner slope of the sample. Left-hand panel: DM profiles for the galaxies containing the most massive (H0, solid lines) and least massive (H11, dotted lines) SMBHs. The configuration without an AGN is shown in green, and the AGN run in blue. The grey area shows radii below the simulations’ physical softening length. Right-hand panel: Ratio between the mean DM density profile in the inner region of each galaxy (within the softening length and 1 kpc) in the AGN vs non-AGN configuration, plotted against the z = 0 SMBH mass.
Current usage metrics show cumulative count of Article Views (full-text article views including HTML views, PDF and ePub downloads, according to the available data) and Abstracts Views on Vision4Press platform.
Data correspond to usage on the plateform after 2015. The current usage metrics is available 48-96 hours after online publication and is updated daily on week days.
Initial download of the metrics may take a while.