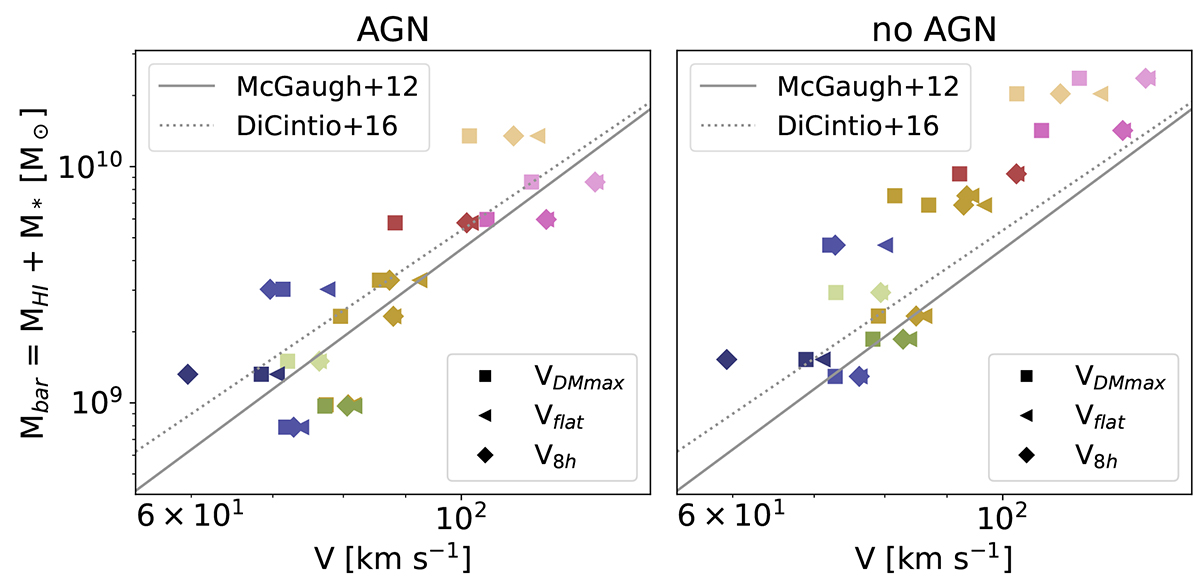
Fig. 4.
Download original image
Baryonic Tully-Fisher relation of simulated dwarf galaxies, run with (left panel) and without (right panel) the inclusion of BH and AGN feedback. Each galaxy’s baryonic mass is measured within the virial radius and shown in a different colour according to its z = 0 BH mass, as in Fig. 3. Different symbols indicate different ways of measuring the rotational velocity, Vrot: VDM, max, Vflat, and V8h are shown as squares, triangles, and diamonds, respectively. The observational relations given by McGaugh (2012), are depicted with the solid line, and the relation obtained in Di Cintio & Lelli (2016) using semi-analytic models with the dotted line. Simulated galaxies that include AGN feedback are in better agreement with the observed BTFR.
Current usage metrics show cumulative count of Article Views (full-text article views including HTML views, PDF and ePub downloads, according to the available data) and Abstracts Views on Vision4Press platform.
Data correspond to usage on the plateform after 2015. The current usage metrics is available 48-96 hours after online publication and is updated daily on week days.
Initial download of the metrics may take a while.