Fig. 1.
Download original image
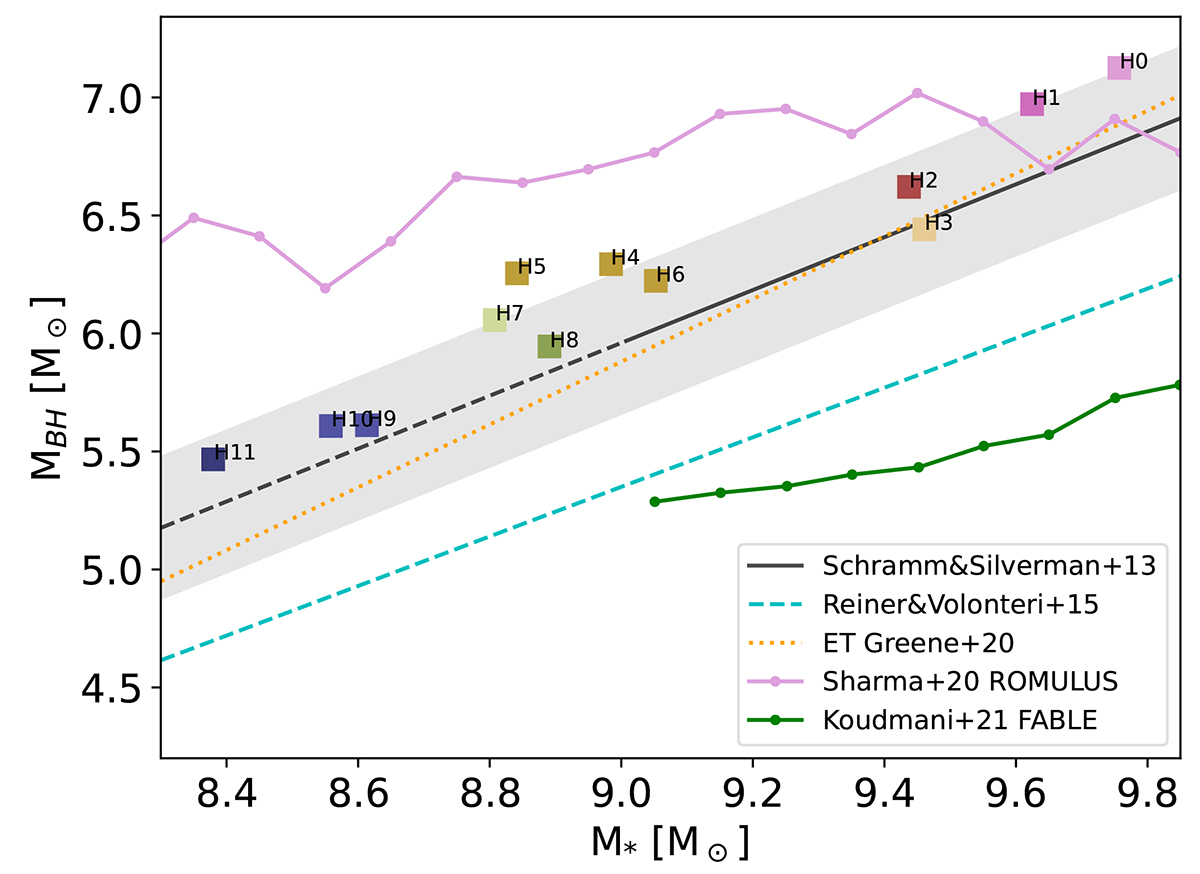
BH mass-stellar mass relation for the 12 AURIGA dwarf galaxies run with the fiducial configuration. Each galaxy is shown in a different colour to facilitate comparisons with the figures in the following sections. The solid black line shows the median relation given by Schramm & Silverman (2013), with the dashed line indicating the range below which such a relation is extrapolated and the shaded area showing a 0.2 dex scatter. The dashed cyan line shows the relation of Reines & Volonteri (2015), while the dotted orange line indicates the same relation for Greene et al. (2020) early-type galaxies. For a comparison with ongoing simulation results, we show in green the mean MBH-M⋆ relation from the FABLE simulations suite (Koudmani et al. 2021) and in purple that from the ROMULUS simulation (Sharma et al. 2020).
Current usage metrics show cumulative count of Article Views (full-text article views including HTML views, PDF and ePub downloads, according to the available data) and Abstracts Views on Vision4Press platform.
Data correspond to usage on the plateform after 2015. The current usage metrics is available 48-96 hours after online publication and is updated daily on week days.
Initial download of the metrics may take a while.