| Issue |
A&A
Volume 675, July 2023
|
|
|---|---|---|
| Article Number | A188 | |
| Number of page(s) | 15 | |
| Section | Cosmology (including clusters of galaxies) | |
| DOI | https://doi.org/10.1051/0004-6361/202245782 | |
| Published online | 19 July 2023 | |
Redshift evolution of the baryon and gas fraction in simulated groups and clusters of galaxies
1
Dipartimento di Fisica e Astronomia, Università di Bologna, Via Gobetti 92/3, 40121 Bologna, Italy
e-mail: This email address is being protected from spambots. You need JavaScript enabled to view it.
2
INAF, Osservatorio di Astrofisica e Scienza dello Spazio, via Piero Gobetti 93/3, 40121 Bologna, Italy
3
INFN, Sezione di Bologna, viale Berti Pichat 6/2, 40127 Bologna, Italy
4
Universitäts-Sternwarte, Fakultät für Physik, Ludwig-Maximilians-Universität München, Scheinerstr.1, 81679 München, Germany
5
Max-Planck-Institut für Astrophysik, Karl-Schwarzschild-Straße 1, 85741 Garching, Germany
6
Hamburger Sternwarte, University of Hamburg, Gojenbergsweg 112, 21029 Hamburg, Germany
7
Istituto di Radio Astronomia, INAF, Via Gobetti 101, 40121 Bologna, Italy
8
INAF, Osservatorio Astronomico di Trieste, via G.B. Tiepolo 11, 34143 Trieste, Italy
9
IFPU, Institute for Fundamental Physics of the Universe, Via Beirut 2, 34014 Trieste, Italy
Received:
23
December
2022
Accepted:
11
May
2023
Abstract
We study the redshift evolution of the baryon budget in a large set of galaxy clusters from the Magneticum suite of smoothed particle hydrodynamical cosmological simulations. At high redshifts (z ≳ 1), we obtain ‘closed-box’ (i.e. baryon mass fraction fbar = Ωbar/Ωtot) systems independently of the mass of the systems on radii greater than 3R500, c, whereas at lower redshifts, only the most massive halos can be considered closed box. Furthermore, in the innermost regions (r < R500, c), the baryon fraction shows a general decrease with redshift, and for less massive objects we observe a much more prominent decrease than for massive halos (fbar × Ωtot/Ωbar = Ybar decreases by ∼4% from z ∼ 2.8 to z ∼ 0.2 for massive systems and by ∼15% for less massive objects in the same redshift range). The gas depletion parameter Ygas = fgas/(Ωbar/Ωtot) shows a steeper and highly scattered radial distribution in the central regions (0.5R500, c ≤ r ≤ 2R500, c) of less massive halos with respect to massive objects at all redshifts, while on larger radii (r ≥ 2R500, c) the gas fraction distributions are independent of the masses or the redshifts. We divide the gas content of halos into the hot and cold phases. The hot, X-ray-observable component of the gas accurately traces the total amount of gas at low redshifts (e.g., for z ∼ 0.2 at R500, c, in the most massive subsample, that is, 4.6 × 10¹⁴ ≤ M500, c/M⊙ ≤ 7.5 × 10¹⁴ and least massive subsample, that is, 6.0 × 10¹³ ≤ M500, c/M⊙ ≤ 1.9 × 10¹⁴, we obtain Ygas ∼ 0.75 and 0.67, Yhot ∼ 0.73 and 0.64, and Ycold ∼ 0.02 and 0.02, respectively). On the other hand, at higher redshifts, the cold component provides a non-negligible contribution to the total amount of baryons in our simulated systems, especially in less massive objects (e.g., for z ∼ 2.8 at R500, c, in the most massive subsample, that is, 2.5 × 10¹³ ≤ M500, c/M⊙ ≤ 5.0 × 10¹³ and least massive subsample, that is, 5.8 × 10¹² ≤ M500, c/M⊙ ≤ 9.7 × 10¹², we obtain Ygas ∼ 0.63 and 0.64, Yhot ∼ 0.50 and 0.45, and Ycold ∼ 0.13 and 0.18, respectively). Moreover, the behaviour of the baryonic, entire-gas, and hot-gas-phase depletion parameters as functions of radius, mass, and redshift are described by some functional forms for which we provide the best-fit parametrization. The evolution of metallicity and stellar mass in halos suggests that the early (z > 2) enrichment process is dominant, while more recent star-formation processes make negligible contributions to the enrichment of the gas metallicity. In addition, active galactic nuclei (AGN) play an important role in the evolution of the baryon content of galaxy clusters. Therefore, we investigate possible correlations between the time evolution of AGN feedback and the depletion parameters in our numerical simulations. Interestingly, we demonstrate that the energy injected by the AGN activity shows a particularly strong positive correlation with Ybar, Ycold, and Ystar and a negative correlation with Yhot and ZTot. On the other hand, Ygas shows a less prominent level of negative correlation, a result which is highly dependent on the mass of the halos. These trends are consistent with previous theoretical and numerical works, meaning that our results, combined with findings derived from current and future X-ray observations, represent possible proxies with which to test the AGN feedback models used in different suites of numerical simulations.
Key words: methods: numerical / large-scale structure of Universe / galaxies: clusters: intracluster medium / galaxies: clusters: general / hydrodynamics
© The Authors 2023
 Open Access article, published by EDP Sciences, under the terms of the Creative Commons Attribution License (https://creativecommons.org/licenses/by/4.0), which permits unrestricted use, distribution, and reproduction in any medium, provided the original work is properly cited.
This article is published in open access under the Subscribe to Open model. This email address is being protected from spambots. You need JavaScript enabled to view it. to support open access publication.
1. Introduction
Evolution of the baryon content in galaxy groups and clusters plays a key role in our understanding of the formation and growth of such systems. Indeed, it is expected that their baryon budget approaches the cosmological ratio between the cosmological baryon density Ωbar and the total matter density Ωm. This condition is described as clusters of galaxies being ‘closed boxes’ (Gunn et al. 1972; Bertschinger 1985; Voit 2005), which in turn allows us to neglect the effects of feedback from galaxy formation (e.g., Allen et al. 2011). However, as we showed in our recent work (Angelinelli et al. 2022, hereafter Paper I), non-gravitational physics related to galaxy formation significantly alters this picture by moving a large number of baryons well beyond the virial radius of their host halos. Only for massive systems (Mvir ≥ 5 × 10¹⁴ h−1 M⊙) and at very large radii (r ≥ 6R500, c) does the baryon fraction approach the cosmological value, verifying the condition for a closed-box system.
Many observational studies (Sun et al. 2009; Ettori 2015; Lovisari et al. 2015; Eckert et al. 2016; Nugent et al. 2020) show how the baryon fraction in the central region (< R500, c) of galaxy groups and clusters increases with the mass of the system. Studying how it evolves with redshift is more challenging given the current observational limitations. In Gonzalez et al. (2013), the authors analyse the baryon content in a sample of 12 galaxy clusters at z ∼ 0.1 and in the mass range between 1 and 5 × 10¹⁴ M⊙ using XMM-Newton. These authors report a dependence of baryon fraction on cluster mass, with a slope of ∼0.16. Moreover, they find that less massive systems (M500 ≤ 2 × 10¹⁴ M⊙) show a larger scatter in baryon fraction, with values spanning from 60% to 90% of the WMAP7 (Komatsu et al. 2011) cosmological expectation Ωbar/Ωm. Nevertheless, also massive systems show a depletion with respect to the cosmological expectation of ∼18%. However, if the assumed cosmology is derived from Planck results (Planck Collaboration Int. IV 2013), the scatter for less massive systems spans from 65% to 100% and the depletion for massive objects decreases to 7%, becoming consistent with the cosmological expectation, because of the systematic errors associated with the mass measurements. Chiu et al. (2016) study a sample of 14 galaxy clusters (with a median redshift of z = 0.9 and masses M500 = 6 × 10¹⁴ M⊙) selected from the South Pole Telescope (SPT) with follow-up data from XMM-Newton and the Chandra telescope. These authors find a baryon fraction of 10.7% with a dependency on cluster mass but not on redshift. In particular, they suggest that the slope of the fbar − M500 relation is ∼0.22, while the uncertainties on the mass estimations introduce an uncertainty in the redshift trend parameter that is larger than the statistical uncertainty, making it impossible to derive any clear evidence of a redshift dependency. Given the relations, the authors conclude that a simple hierarchical structure formation merger model is not sufficient to completely describe the accretion of galaxy clusters or groups. Significant accretion of galaxies and intracluster medium (ICM) from the field in combination with the loss of stellar mass from galaxies through stripping would be needed to completely explain the observational findings they discuss. More recently, Akino et al. (2022) study a sample of 136 galaxy clusters and groups with M500 masses of between 1013 and 1015 M⊙ and a redshift range that spans from 0 to 1. These authors perform a joint analysis using HSC-SSP weak-lensing mass measurements, XXL X-ray gas mass measurements, and HSC and Sloan Digital Sky Survey multi-band photometry. They find that the mass relation of the baryon fraction system shows a steepening of the slope moving from the group regime to the clusters. Moreover, Akino et al. (2022) find that the baryon fraction is ∼50% for ∼1013 M⊙, ∼60% for ∼1014 M⊙, and ∼100% for ∼1015 M⊙ systems with respect to the cosmological expectation Ωbar/Ωm, assumed from Planck Collaboration VI (2020). Even if the relation between the baryon fraction and the mass of the system is observed, it is not possible to obtain strong constraints on the baryon fraction–redshift because of uncertainties in mass estimations.
Using a semi-analytic model that links the ‘universal’ behaviour of the thermodynamic profiles with the integrated properties of the ICM, modelling the departure from self-similarity, including dependence of the gas mass fraction within R500 on gas temperature and redshift, Ettori et al. (2023) find that the gas-mass fraction depends on the temperature with a relation about T0.4 and the redshift contribution is almost negligible by the calibrations with a collection of recently published scaling laws.
By connecting the co-evolution of galaxies and AGN in groups and clusters of galaxies and the induced circulation of baryons, many numerical works have explored the evolution of baryon fraction across cosmic time. Duffy et al. (2010) used a sample of galaxy clusters extracted from the OverWhelmingly Large Simulations project (Schaye et al. 2010). These authors find that simulations with strong feedback (both from AGN or supernovae) decrease the baryon fraction on galaxy-scale haloes by a factor of 2 or 3. On group and cluster scales, only simulations that include appropriate levels of AGN feedback can reduce the observed baryon fraction, at least within a factor approximately 2. Simulations that include inefficient cooling and stellar feedback and those with strong feedback models accurately reproduce the stellar fraction for massive objects. On the other hand, only the simulations with strong AGN feedback reproduce the observed star formation efficiencies. Planelles et al. (2013) use a set of simulations using the TreePM–SPH GADGET-3 code, including a combination of stellar and AGN feedback and non-radiative effects. These latter authors find that for non-radiative and stellar-only feedback runs, the baryon fraction with R500 does not show any strong dependence on the mass of the central clusters and it deviates from the cosmological expectation by as much as ∼10%. On the other hand, AGN feedback is responsible for the depletion of baryon content in the galaxy group mass regime, and the cosmic value is only reached for massive systems. Moreover, Planelles et al. (2013) study possible dependences of the baryon fraction on the radius from the cluster centre, system mass, and redshift; they do not find any particular trend and suggest that further improvements could be obtained with extension of the simulations with other feedback models. Henden et al. (2020) analyse the baryon content in the ‘feedback acting on baryons in large-scale environments’ (FABLE) simulations. These simulations are performed using the AREPO code (Springel 2010). The prescriptions for stellar and AGN feedback are revisited versions of the models (Henden et al. 2018) adopted in the Illustis simulations (Vogelsberger et al. 2014). Henden et al. (2020) find good agreement between their findings and the observational proxies provided by X-ray observations. This implies that, when weak-lensing measurements are considered and the hydrostatic mass bias is taken into account, the systems analysed by Henden et al. (2020) are found to be too gas rich, meaning that the models must be revisited in order to reproduce the most accurate observational constraints. Moreover, their findings suggest that there is a different evolution with cosmic time in systems with different masses. Indeed, for massive systems (M500 > 3 × 10¹⁴ M⊙), the total gas and stellar mass are approximately independent of redshift at z ≤ 1. On the other hand, less massive systems show a significant redshift evolution. The authors conclude that this is important for understanding the different growth of massive galaxy clusters and smaller systems; it is expected that the former accumulated their mass by accreting low-mass systems, while the latter seem to show little redshift evolution themselves. Davies et al. (2020) compare results from EAGLE (Schaye et al. 2015; Crain et al. 2015) and Illustris-TNG (Pillepich et al. 2018; Nelson et al. 2018; Springel et al. 2018) simulations. Although these simulations share aims and scope, they are very different in the recipes adopted for hydrodynamics solvers and the solutions of the physical processes included, especially concerning the feedback processes. In their work, Davies et al. (2020) focus on the properties of the circumgalactic medium (CGM) and the quenching and morphological evolution of central galaxies. They find that in both EAGLE and Illustris-TNG simulations, the influence of halo properties on central galaxies is mainly driven by the expulsion of CGM. Moreover, these authors find that feedback is also responsible for the heating of the remaining CGM, which contributes to the growth of the cooling time and inhibits the accretion of gas. The results from the two simulation suites are similar, but there are also some differences, which can in principle be tested from an observational point of view. Indeed, by studying the scaling relations between the column density of CGM OVI absorbers and the specific star formation rate of central galaxies at fixed halo mass, or between the CGM mass fraction of haloes and the accretion rate of their central black hole (BH), it is possible to analyse the results of the different models adopted in the different simulations, which predict different scenarios for these relations. The authors conclude that, even if some differences are observed between these simulations, the role of the AGN feedback on the CGM and central galaxies is dominant in the entire cosmic evolution of such systems. Sorini et al. (2022) studied the impact of baryon-driven physical processes on the large-scale structure and internal mass distribution of halos. These authors used the SIMBA cosmological simulations (Davé et al. 2019), which incorporate feedback prescriptions from both stars and AGN and four additional variations of the simulation with some feedback mechanisms turned off. The presence of baryons in halos and the large-scale structure were examined separately from the role of feedback. To explore this, a dark-matter-only version of SIMBA was also run. Sorini et al. (2022) conclude that AGN-driven jets play a crucial role in depleting baryons from massive halos (> 1012 M⊙) at z < 2. Moreover, they are the primary source of heating and the cause of suppressed star formation in such halos during later stages. Moreover, the authors find that in the absence of AGN jets, the baryon mass within the virial radius of massive halos accounts for over 90% of the cosmic baryon mass fraction. However, when AGN jets are active, the baryonic mass needs to be considered up to 10–20 virial radii away from halos to reach the cosmic baryon mass fraction. Thus, the influence of AGN jets extends beyond halos and affects the intergalactic medium (IGM). Jets drive the proportion of hot IGM gas (T > 106 K) from approximately 30% to 70% at z = 0. Cui et al. (2022) introduced a new set of simulated galaxy clusters called Gizmo-Simba, as part of The Three Hundred project. These simulations were conducted using a feedback model based on the SIMBA simulations (Davé et al. 2019). The feedback model parameters were re-tuned to account for the lower resolution of The Three Hundred clusters. Using the 324 simulated galaxy clusters part of The Three Hundred project, the authors performed a detailed comparison between these new simulations, the previous Gadget-X simulations and the observational results. Cui et al. (2022) find similar stellar mass fractions at r < R500, c) and z = 0 between Gadget-X and Gizmo-Simba, consistent also with observational results. However, there are differences in their gas fractions at z = 0 for low-mass halos (around 5% in absolute mass fraction at M ∼ 1014 M⊙). These differences are observed at all redshifts, whether at a fixed halo mass or by tracking progenitors. The disparity in gas fractions is likely attributed to the feedback scheme, with Gizmo-Simba’s kinetic feedback being particularly strong and effectively expelling gas from halos. However, the authors note that Gizmo-Simba simulations exhibit a much stronger evolution of the stellar mass fraction with redshift compared to Gadget-X, especially at high redshifts (z > 1.5). They propose two possible causes: the star formation model in Gizmo-Simba is more efficient, leading to a higher stellar mass fraction at high redshifts; galaxy quenching occurs rapidly and thoroughly, primarily at high redshifts. The high star formation rate in Gizmo-Simba resulted in a higher stellar mass fraction at early epochs, while the complete cessation of star formation in later epochs brought its stellar mass fraction closer to that of Gadget-X by z = 0. Recently, Robson & Davé (2023) studied a sample of simulated galaxy clusters and groups extracted from the SIMBA simulations (Davé et al. 2019), with masses M500 from 1012.3 M⊙ to 1015 M⊙. These authors analyse the evolution of the X-ray scaling relations and X-ray profiles from z = 3 to z = 0, and moreover study the impact of different feedback models in comparison with the self-similar evolution. Robson & Davé (2023) find that halos show a consistent slope with the self-similar slope for z > 1.5, while at lower redshifts, the number of groups that deviate from self-similarity increases. Regarding the relation between gas fraction and halo mass, these authors observe a drop in the profile and an increase of the scatter with redshifts z < 1.5, especially for halos with M500 < 1013.5 M⊙. Comparing simulations that include or exclude different feedback models, Robson & Davé (2023) observe that only the AGN feedback is able to highly influence the scaling relations they analysed. In particular, these authors find that, for halos with M500 < 1013.5 M⊙, the gas fraction is lowered by the AGN feedback, meaning reduction of the X-ray luminosity and temperature of these systems. On the other hand, the gas metallicity seems to be the only parameter that is more influenced by stellar feedback than that from AGN. Robson & Davé (2023) highlight that their analysis is designed to address the connection between galaxy quenching and X-ray properties across cosmic time and that their results could be useful as a basis for comparison with other physical models and future observations.
In this work, we perform a detailed analysis of the baryon content of galaxy clusters and its redshift evolution in a sample of halos simulated in the Magneticum1 suite. We understate the role of gas and its different phases, and the stellar component. We also pay particular attention to the correlations between AGN feedback energy and the possible traces of these interactions in the evolution of the baryonic distribution. The paper is structured as follows: in Sect. 2, we briefly describe the Magneticum simulations and how we select our sample. In Sect. 3, we present the results of our analysis and a comparison with recent observations. In Sect. 4, we discuss our main findings and the correlations between AGN feedback and baryons evolution, and in Sect. 5, we summarise our results and possible future extensions of this work.
2. The Magneticum cosmological simulations
We selected a subsample of galaxy clusters from Box2b/hr of the Magneticum simulations at eight different snapshots, which correspond to redshifts 2.79, 1.98, 1.71, 1.18, 0.90, 0.67, 0.42, and 0.25. The high-resolution run of Box2b includes a total of 2 × 28803 particles in a volume of (640 h−1 cMpc)3. The particle masses are 6.9 × 10⁸ h−1 M⊙ and 1.4 × 10⁸ h−1 M⊙, respectively, for the dark matter and gas component and the stellar particles have a softening of ϵ = 2 h−1ckpc. The cosmology adopted for these simulations is the WMAP7 from Komatsu et al. (2011), which has a total matter density of Ωm = 0.272 –of which 16.8% is made up of baryons–, the cosmological constant Λ0 = 0.728, the Hubble constant H0 = 70.4 km s−1 Mpc−1, the index of the primordial power spectrum n = 0.963, and an overall normalisation of the power spectrum of σ8 = 0.809. The most relevant physical mechanisms included in Magneticum are cooling, star formation, and winds with velocities of 350 km s−1 (Springel & Hernquist 2002). These simulation explicitly trace metal species (namely, C, Ca, O, N, Ne, Mg, S, Si, and Fe) and follow, in detail, the stellar population; chemical enrichment by SN-Ia, SN-II, and AGB (Tornatore et al. 2003, 2007), with cooling tables from Wiersma et al. (2009); black holes and associated AGN feedback (Springel et al. 2005), with various improvements (Fabjan et al. 2010; Hirschmann et al. 2014) for the treatment of the black hole sink particles and the different feedback modes. Also incorporated are isotropic thermal conduction of 1/20 of the standard Spitzer value (Dolag et al. 2004), a low viscosity scheme to track turbulence (Dolag et al. 2005; Beck et al. 2016), higher order SPH kernels (Dehnen & Aly 2012), and passive magnetic fields (Dolag & Stasyszyn 2009). Halos are identified using SUBFIND (Springel et al. 2001; Dolag et al. 2009), where the centre of a halo is defined as the position of the particle with the minimum gravitational potential. The virial mass, Mvir, is defined through the spherical overdensity as predicted by the generalised spherical top-hat collapse model (Eke et al. 1996) and, in particular, it refers to Rvir, whose overdensity with respect to the critical density follows Eq. (6) of Bryan & Norman (1998), which corresponds to ≈117 for the given redshift and cosmology. The radii R200,m and R500, c are defined as a spherical-overdensity of 200 (respectively 500) with respect to the mean (respectively critical) density in the chosen cosmology.
As shown in previous studies, the galaxy physics implemented in the Magneticum simulations leads to a generally successful reproduction of the basic galaxy properties, such as the stellar mass-function (Naab & Ostriker 2017; Lustig et al. 2023), the environmental impact of galaxy clusters on galaxy properties (Lotz et al. 2019), and the appearance of post-starburst galaxies (Lotz et al. 2021) as well as the associated AGN population at various redshifts (Hirschmann et al. 2014; Steinborn et al. 2016; Biffi et al. 2018a). At cluster scales, the Magneticum simulations have been shown to reproduce the observable X-ray luminosity relation (Biffi et al. 2013), the pressure profile (Gupta et al. 2017) and chemical composition of the ICM (Dolag et al. 2017; Biffi et al. 2018b), the high concentration observed in fossil groups (Ragagnin et al. 2019), and the gas properties in between galaxy clusters (Biffi et al. 2022). On larger scales, the Magneticum simulations are able to reproduce the observed SZ-Power spectrum (Dolag et al. 2016) as well as the observed thermal history of the Universe (Young et al. 2021).
In each selected snapshot, we selected the 150 most massive galaxy halos. The final sample (combining all the different snapshots) is composed of 1200 galaxy clusters, described by a M500, c mass range between ∼1013 h−1 M⊙ and ∼1015 h−1 M⊙ (see Table 1 for details on the mass range). Moreover, for each snapshot, we divided the sample into ten equal bins in logarithmic space, so that each bin contains 15 objects. As described in Paper I, we extend our radial analysis up to 10R500, c. Firstly, we consider the position of the accretion shocks as the location of the peak of the entropy profile (as proposed in Vazza et al. 2011) and we find that in our systems it is closer to ∼6R500, c. The position of the accretion shocks is often used as the boundary of galaxy clusters (see Zhang et al. 2020; Aung et al. 2021, for details on the definitions and expected locations of accretion shocks) and extending our analysis to regions external to the accretion shocks ensures that we are mapping the entire volume of a given halo and allows us to characterise its baryon and gas mass fraction.
Minimum and maximum halos masses (M500, c and Mvir) for each selected redshift.
The dynamics of accreting gas, which mostly gets shock heated during its first infall, are different from those of the collisionless dark matter. Thus, while the radius of accretion shocks defines the spatial extent of the gas in the DM halos, a different boundary must be defined using DM particles only (e.g., Walker et al. 2019). One example is the splashback radius Rsp (Adhikari et al. 2014), which represents the apocenter (farthest point of the particle orbit with respect to the halo potential minimum) of infalling dark matter through the pericentre. Many different works2 have demonstrated that Rsp is ∼ 2.5R200,c. As R200,c ∼ 1.6R500,c, Rsp is ∼ 4R500,c, which is closer to the halo centre than the radius of the accretion shock. This means that the assumption of the accretion shock radius as a boundary of the halo, combined with an extension of the analysis to radii larger than the accretion shock position, ensures that, in the present work, we consider all the baryons that are enclosed in the simulated halos.
3. The cosmic depletion parameters
We are interested in the cosmological evolution of different matter components within simulated groups and clusters, and similar to Paper I, we want to focus on volume-integrated quantities, that is baryon, gas, and star fractions:
 (1)
(1)
 (2)
(2)
 (3)
(3)
where r is the radial distance from the cluster centre. The different mi(< r) refer to different particle types (gas, stars, or black holes), while mtot(< r) is the sum of the previous masses and the dark matter up to the radial shell r. We divide the gas component of our systems into two different phases, namely fhot, which considers the gas particles with a temperature greater than 0.1 keV, and fcold, which considers the remaining ones:
 (4)
(4)
 (5)
(5)
Finally, we refer to the cosmic depletion parameter Y, defined as
 (6)
(6)
where f(< r) could assume any of the definitions given above, and Ωbar/Ωm = 0.168 is the cosmological value of baryon mass over total matter adopted for Magneticum simulations.
The 0.1 keV (∼106 K) threshold is used as a conservative lower limit on the gas temperature to consider the gas that can be detected by X-ray observatories (see Mazzotta et al. 2004; Rasia et al. 2014; Biffi et al. 2022, for details on the comparison between simulations and X-rays observations). This temperature also includes part of the baryons that are considered ‘missing baryons’ of the warm-hot intergalactic medium (see Nicastro et al. 2018, for details on the observational proprieties of this gas phase).
3.1. Depletion parameters within R500, c
Firstly, we focus on the innermost regions of galaxy clusters. Figure 1 shows the baryon depletion parameter inside R500, c as a function of the mass of the host cluster. From the left plot of Fig. 1, we observe a general decrease in the baryon depletion parameter across cosmic time. From the right panel, we follow the redshift evolution of the baryon depletion parameter of a single mass bin. Massive objects show a flatter behaviour than less massive systems, and for the latter, the baryon depletion parameter decreases by ∼15% from z = 2.79 to z = 0.25 (see Table A.1).
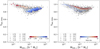 |
Fig. 1. Baryon depletion parameter inside R500, c. The grey dots represent single galaxy clusters, identified by different markers, accordingly to the legend in the bottom left corner. Left: the coloured dots represent the median values computed in each of the mass bins of a single snapshot. The colour coding is given by the snapshot’s redshift, following the colourbar in the bottom right corner. Right: the coloured lines represent the redshift evolution of each mass bin. The colour coding is given by the mass bin, following the colourbar in the bottom right corner. |
We compare our findings with the observational constraints within R500, c, from recent work by Eckert et al. (2021) and Akino et al. (2022), where different best fits were proposed to describe the gas fraction as a function of the mass of the host cluster. Figure 2 shows these best fits against our findings for gas and hot-gas-phase depletion parameters, and includes the results presented by Chiu et al. (2016) and already introduced in Sect. 1. As in Paper I, our results are able to correctly reproduce the observational findings, and for low-redshift (z < 1.2) halos they show an increase in the gas fraction with cluster mass. On the other hand, in high-redshift (z > 1.2) halos, the gas fraction appears to be independent of the mass of the central cluster, with values of Ygas ∼ 0.65. In the right plot of Fig. 2, we show the hot gas phase depletion parameter inside R500, c as a function of cluster mass. Comparing the left and right plots of Fig. 2, we notice that, for low-redshift systems, the hot gas phase is able to completely recover the total gas depletion fraction. On the other hand, for high-redshift systems, the hot component is always a fraction of the total gas amount of galaxy clusters. This implies that, for high-redshift systems, the cold gas component is far from negligible, even in the most massive halos, which itself suggests that, in forming systems closer to their formation time, the virialisation process is far from complete, and large fractions of the gas mass are still cold; this also suggests that our earlier findings in Paper I become increasingly less accurate as we move to higher redshifts.
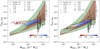 |
Fig. 2. Gas depletion parameter (left) and hot-gas-phase depletion parameter (right) inside R500, c. The grey dots represent single galaxy clusters, and these are identified by the different markers listed in the legend in the bottom right corner. The coloured dots represent the median values computed in each of the mass bins of a single snapshot. The colour coding is given by the snapshot’s redshift following the colour bar in the top left corner. The solid lines (and related shadow regions) represent the fits proposed by Eckert et al. (2021; |


In this respect, the differences between the hot-gas-phase component and the total amount of gas embedded in high-redshift galaxy clusters are particularly important in the study of proto-galaxy clusters. Indeed, these objects, which are characterised by relatively low masses and high redshifts, seem to show the highest displacement between the real amount of gas and the amount recovered by X-ray observations. Further investigations are needed to completely assess these differences and understand how to take them into account in the computation of real proto-cluster masses (see Overzier 2016, for a review on proto-clusters).
3.2. Depletion parameters up to 10R500, c
In Fig. 3, we show the median distributions of the baryon depletion parameters as a function of radius (between 0.5R500, c and 10R500, c) for the less massive and most massive mass bins, computed for each redshift. In Fig. 3, we identify a redshift evolution of the profiles. Indeed, in the innermost regions (r < R500, c), we observe a decrease of ∼0.40% moving from z = 2.79 to z = 0.25. In regions far from the cluster centre (r < 5R500, c), the differences between low- and high-redshift systems are less than 10% for less massive objects and are less than 5% for massive ones. At low redshifts, the closed-box assumption remains true only for massive objects and at radii greater than 5R500, c (see also Paper I). At high redshifts, the same condition is reached independently of the halo mass and at radii closer to 3R500, c.
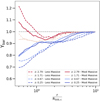 |
Fig. 3. Radial profiles of the baryon-depletion parameter, from 0.5R500, c to 10R500, c, for the least massive bin (dashed lines) and most massive bin (solid lines). The lines represent the median profiles at four different redshifts, for which the colour code is shown in the bottom right corner (see Table A.1 for the definition of the mass ranges). |
In Fig. 4, we present the median gas-depletion parameters as a function of radius for the less massive and most massive mass bins, computed in each redshift investigated. At high redshifts, the differences between low- and high-mass objects are less than 10%, while at low redshifts the same differences are larger than 20%. Figure 4 shows an increase in the gas content with radius. This increase is steeper for less massive objects at low redshift, whereas for massive systems the trend is rather independent of redshift. In each of the analysis cases, the gas depletion parameter approaches values of between 85% and 90% at 10R500, c, independent of the mass or the redshift.
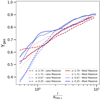 |
Fig. 4. Radial profiles of gas depletion parameter, from 0.5R500, c to 10R500, c, for the less massive bin (dashed lines) and most massive one (solid lines). The lines represent the median profiles at four different redshifts, for which the colour code is shown in the bottom right corner (see Table A.1 for the definition of the mass ranges). |
Figure 5 shows the median hot-gas-phase depletion parameters as a function of the distance from the cluster centre for the less massive and most massive mass bins, computed for each redshift. Differently from the profiles of baryon and gas-depletion parameters presented in Figs. 3 and 4, here the profiles show a marked peak and the following drop. This trend was discussed in Paper I, where we surmised that the position of the peak is closer to the position of the accretion shock. Interestingly, here we can further observe a shift of the peak to the outer regions with a simultaneous decrease in redshift. This is compatible with an increase in the halo volume with cosmic time, which is marked by the expansion of the outer accretion regions. We also notice that most massive objects have a higher contribution of hot gas at every redshift. Moreover, comparing Figs. 4 and 5, we note that, for low-redshift systems, the total amount of gas within the volume of the cluster is perfectly traced by the hot component, while for high-redshift objects the hot gas phase is always less than 75% of the total gas. Therefore, in high-redshift galaxy clusters, the hot and X-ray-observable part of the gas represents only a fraction of the total gas mass, making it indispensable to correct the derived mass in order to make any accurate cosmological use of it.
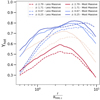 |
Fig. 5. Radial profiles of the depletion parameter for the hot gas phase, from 0.5R500, c to 10R500, c, for the less massive bin (dashed lines) and most massive bin (solid lines). The lines represent the median profiles at four different redshifts, for which the colour code is shown in the top right corner (see Table A.1 for the definition of the mass ranges). |
3.3. Gas metallicity and stellar component
The injection and evolution of metals by SN-Ia, SN-II, and AGB stars in Magneticum simulations are modeled following Tornatore et al. (2003, 2007). As already done in Paper I, we consider the total metallicity as the sum of the elements heavier than helium relative to the hydrogen mass. The total metallicity at each radial shell r, Ztot(r), is the mass-weighted sum of the metallicity of the gas particles i with mass mgas, i which belong to the radial shell r:
 (7)
(7)
The radial shells are defined to include a fixed number of 250 particles in order to allow a significant statistical analysis of each of them. We normalise these values of metallicity to the solar values proposed by Asplund et al. (2009): Z⊙ = 0.0142. In Fig. 6, we show the median distributions of the total metallicity as a function of the radius for the least massive and most massive mass bins, computed for each redshift. Here we note that the profiles are highly scattered, as already discussed and justified in Paper I. Moreover, although no strong mass dependences are observed, we notice a clear evolution of total metallicity over time. Indeed, independently of the mass bin analysed, the values of metallicity increase towards lower redshifts. In the external part of the galaxy clusters, on radii larger than 2 ÷ 3R500, c, we observe a general flatting of the profiles. This trend is slightly prominent in high-redshift systems.
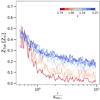 |
Fig. 6. Radial profiles of gas metallicity (in Solar units) from 0.5R500, c to 10R500, c for the least massive bin (dashed lines) and most massive bin (solid lines). The lines represent the median profiles at four different redshifts, for which the colour code is shown in the top right corner (see Table A.1 for the definition of the mass ranges). |
Figure 7 provides the median distribution of the stellar depletion parameter as a function of radius for the least massive and most massive objects, computed in each redshift. Differently from the case of baryons, gas, and hot gas phases, here we observe a gradual decrease in the stellar depletion parameter with increasing distance from the cluster center. Instead, similar to the metallicity profiles, for the stellar depletion factor we also do not observe any mass-associated trend. However, especially in the innermost regions, the values of the stellar depletion parameter decrease with redshift, while in the outskirts of halos the differences between different redshifts are of the order of a few percent. Halos in all mass bins approach a stellar depletion parameter of Ystar ∼ 0.1 at the boundary of the analysed volumes (∼10R500, c).
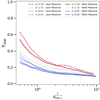 |
Fig. 7. Radial profiles of stellar depletion parameter from 0.5R500, c to 10R500, c for the least massive bin (dashed lines) and most massive bin (solid lines). The lines represent the median profiles at four different redshifts, for which the colour code is shown in the top right corner (see Table A.1 for the definition of the mass ranges). |
4. Discussion
Recently, many different works have explored the evolution of baryons in simulated halos (Castro et al. 2021; Ragagnin et al. 2022; Ayromlou et al. 2022; Robson & Davé 2023). In our work, we analyse a sample of galaxy clusters extracted from Magneticum simulations. As opposed to other works, the simulated volume of Box2b is large enough to allow a selection of very massive objects (M500,c > 1015 M⊙/h at z = 0). Moreover, as also discussed by Robson & Davé (2023, see their Fig. 10 and related discussion), the effects of different feedback phenomena highly influence the evolution of baryons in the simulated halos. From the comparison between Magneticum simulations and other suites of numerical simulations, we can assess the impact of different feedback models on the evolution of baryons simulated in halos. For each simulated snapshot, we select the 150 most massive halos (see Table 1 for details on the mass range). This selection minimises the effect of mergers and phenomena that occur in the history of single objects. Indeed, in the most massive objects, gravity can compensate for the effect of AGN feedback, and the evolution we recover is less affected by internal feedback phenomena. On the other hand, the other possible approach is to trace the time evolution of a sample of massive objects at z = 0. In this case, the results are probably affected by the history of the single objects, and the evolution of the baryon content may be influenced by mergers or peculiar phenomena that occur in specific objects, making the results less statistically robust. Moreover, this approach does not ensure that at high redshifts the sample still remains mass-complete. Indeed, as the mass growth of halos is determined by merger phenomena particular to individual objects, halos that at high-z belong to the most massive mass bin may in their history not grow to sufficient masses to still belong to the most massive subsample at z = 0. Furthermore, due to observational limitations, the observed samples of galaxy clusters are composed of very massive objects, especially for high-z observations. The selection we decided to adopt in our work is therefore closer to what can be reproduced to date with X-ray observations. Robson & Davé (2023) also highlight the major role of the feedback model in estimations of the properties of galaxy clusters and groups derived from X-ray observations. It is therefore essential to build simulated samples that are as similar as possible to those that can be obtained from X-ray observations. This will allow a closer comparison between the different feedback models used in the simulations and their comparison with observations and will therefore enable us to gain a better understanding of the real effect of feedback phenomena on the evolution of baryons in halos. We defer this to future work.
Castro et al. (2021) investigate the role of AGN feedback in the halo accretion history in the Magneticum simulations. The energy introduced in the surrounding environment by the AGN is proportional to the mass-accretion rate of the black hole ṀBH (Springel 2005; Hirschmann et al. 2014). The authors conclude that AGN feedback has a nearly time-universal behaviour. They find that the peak of the AGN feedback occurs at a slightly higher redshift than the baryon fraction peak. They also observe a fast decay around z = 1, followed by a slow decay phase at lower redshifts. Moreover, Castro et al. (2021) note a rather universal trend in the response to the AGN activity. The variation of halo mass shows a significant and negative correlation with the intensity of AGN feedback when halo progenitors reach ∼30%−50% of their final mass. Castro et al. (2021) conclude that the decrease in halo mass observed in simulations is driven by the action of AGN feedback in a relatively early phase of the halo assembly, when the shallower potential well of the galaxy cluster can better react to the displacement of gas heated by feedback.
Recently, Ragagnin et al. (2022) study the ejection of gas from the halo attributable AGN feedback in Magneticum simulations. These authors find that the gas fraction in galaxy clusters with a redshift formation of greater than 1 is lower than that observed for systems with lower redshift formation. This difference is associated with the amount of gas present at the epoch of formation and later ejected by AGN activity. Indeed, when the amount of ejected gas is taken into account, the distributions of gas fraction recovered are independent of the formation redshift of galaxy clusters.
Starting from the finding of Castro et al. (2021) and Ragagnin et al. (2022), we investigate the role of AGN feedback in the time evolution of the depletion parameters. In the following, we do not include the energy feedback from stellar processes, because of its minor contribution with respect to AGN feedback at the redshifts we are interested in (see Ragagnin et al. 2022, and reference therein). We define the feedback energy as the ratio between the mass-accretion rate ṀBH and the thermal energy of galaxy clusters inside R500, c,
![Mathematical equation: $$ \begin{aligned} E_{\rm feedback} = \frac{\dot{M}_{\rm BH} \ c^2 \ \epsilon _{r} \ \epsilon _{f}}{(M_{\rm gas,500c}/[\mu \ m_{p}] ) \times (T_{\rm gas,500c}/[\mathrm{erg}])} ,\end{aligned} $$](/articles/aa/full_html/2023/07/aa45782-22/aa45782-22-eq10.gif) (8)
(8)
where ṀBH is computed as the difference in mean black hole mass between two consecutive time steps and ϵr and ϵf are the parameters proposed by Hirschmann et al. (2014), who take into account the amount of feedback energy thermally coupled to the surrounding gas. For each redshift, we compute the median values of depletion parameters and metallicity for the entire sample of galaxy clusters. The results are shown in the left panel of Fig. 8. Here, we observe that the feedback energy rapidly decreases with redshift, as already observed and discussed by Castro et al. (2021). Moreover, we note that baryon, cold-gas-phase, and stellar-depletion parameters show a decrease with redshift, whereas gas, hot-gas-phase, and metallicity show the opposite behaviour. These trends suggest the presence of correlations between feedback energy and the quantities analysed. The right panel of Fig. 8 shows the Pearson correlation indices computed between the time evolution of the feedback energy and the depletion parameters and metallicity. Focusing on the redshift range from z ∼ 2 to z ∼ 0.2, we present the results both for galaxy clusters divided into the same ten mass bins adopted above and for the median values of the entire sample. As already observed, but now quantified by the Pearson correlation index, we note that the baryon, cold-gas-phase, and stellar depletion parameters show a correlation with energy feedback, while the gas and hot-gas-phase depletion parameters, as well as metallicity, show anti-correlated trends. In particular, we observe that in all the parameters analysed, except for the gas-depletion parameter, the mass of the galaxy clusters does not change the correlation or anti-correlation trend. On the other hand, for the gas depletion parameter, we note a shift from correlation to anti-correlation with an increase in the mass of the systems associated with the mass bins. This trend is associated with the relative impact of the different gas phases in different galaxy cluster subsamples. Indeed, in less massive systems, we note that the hot component is less dominant than in more massive galaxy clusters. This suggests that for less massive systems, the total gas depletion parameter is driven by the cold phase, which has a high level of correlation with feedback energy. Instead, for massive systems, the hot gas phase is completely dominant over the cold gas phase. The hot gas phase shows a high level of anti-correlation with the feedback energy, and this leads to an increase in the anti-correlation observed between the total gas depletion parameter and the feedback energy. Table 2 reports the Pearson correlation indices discussed above.
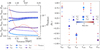 |
Fig. 8. Redshift evolution in the range 0.2 ≲ z ≲ 2 in terms of feedback, depletion parameters, and metallicity and their correlations inside R500, c. Left: median values of depletion parameters, metallicity, and feedback energy proxy as a function of redshift. The different lines (explained in the inset at the bottom) represent the median values computed for the entire galaxy cluster sample at each redshift. Right: pearson correlation index of the redshift evolution computed between the feedback energy proxy and depletion parameters or metallicity. The coloured dots represent the median values computed in each mass bin (following the colour coding shown by the colour bar in the middle of the plot), while the dots identified by different markers (explained in the legend in the middle of the plot) show the median values computed for the whole sample. |
Pearson correlation index of the redshift evolution computed between the feedback energy proxy and depletion parameters or metallicity inside R500, c for the least massive subsample, the most massive subsample, and the entire sample.
Lapi et al. (2005) proposed a model relating the energy injected by an event of AGN activity and the fractional mass ejected by this event. In particular, the authors compute the energy introduced by an AGN event and the thermal energy of the hosting system. This quantity has the same meaning as our definition of feedback energy. Lapi et al. (2005) demonstrate that this energy ratio is related to the fractional mass ejected from the galaxy cluster environment. More specifically, these authors demonstrate that Δm/m ≃ ΔE/2E. To compare these findings with our analysis, we consider the fractional mass as the change in baryon fraction over consecutive time steps, and also consider the time-integrated contribution of the feedback energy. Figure 9 shows the time evolution of time-integrated feedback energy (dE/E), the baryon fraction change (dM/M − Data), and the prediction for the fractional mass evolution given by the model of Lapi et al. (2005; dM/M − Lapi + 05). We note that the feedback energy rapidly increases around redshift z = 2, while a flat behaviour is observed at lower redshift. On the other hand, the baryon fraction change increases more slowly than both the feedback energy and the prediction of the model, with the latter depending only on the energy injected. The differences between the baryon fraction change we recover and the prediction of the model are related to the assumption adopted for the model. Indeed, the model proposed by Lapi et al. (2005) only takes heating phenomena into account, whereas at high redshift, gravitational effects such as accretion and merger events make non-negligible contributions, making the model assumptions less effective.
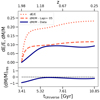 |
Fig. 9. Time evolution of feedback energy and mass depletion inside R500, c. Top: the dotted line represents the time-integrated ratio between feedback energy and the thermal energy of the system (“dE/E”), and the solid line shows the mass depletion computed as the difference between the baryon fraction in two consecutive time steps (“dM/M − Data”), the dashed line represents the expected mass depletion computed as |

Ayromlou et al. (2022) recently compared three different suites of numerical simulations, Illustris-TNG (Pillepich et al. 2018; Nelson et al. 2018; Springel et al. 2018), EAGLE (Schaye et al. 2015; Crain et al. 2015), and SIMBA (Davé et al. 2019), to understand the evolution of the baryon content in halos with M200, c masses of between 108 M⊙ and 1015 M⊙, that is, from the halo centre up to 30R200, c. Ayromlou et al. (2022) demonstrate that baryon feedback mechanisms greatly influence the baryon distribution, lowering the baryon budget within the halos and accumulating matter outside the virial radius of these systems. Moreover, these authors find that halos with different mass ranges are influenced by different feedback mechanisms. In particular, they show that for low-mass systems (108 ≤ M200, c/M⊙ ≤ 1010) the main source of heating is given by the UV background; for intermediate mass halos (1010 ≤ M200, c/M⊙ ≤ 1012) stellar feedback becomes dominant; while for massive systems (1012 ≤ M200, c/M⊙ ≤ 1014) the main source of feedback is given by the central AGN. Furthermore, Ayromlou et al. (2022) conclude that galaxy clusters with masses M200, c/M⊙ ≥ 1014 are less affected by feedback phenomena, while less massive objects are more affected by the effects of feedback energy. They also propose a new characteristic scale based on the closure radius Rc, which represents the radius at which all the baryons associated with a halo can be found. The authors define Rc as
 (9)
(9)
where Δfbar, cosmic represents the observational uncertainty on the cosmic baryon fraction, which they assume to be 0.05 (Planck Collaboration XIII 2016), and find that the closure radius is closer to R200, c in massive systems, while it tends to increasingly outer regions for objects in which the mass is gradually smaller. Moreover, Ayromlou et al. (2022) show that the position of the closure radius also depends on the model adopted in different simulations. Indeed, the simulations they used give different positions of the closure radius for objects with the same masses. Starting from these findings, we compute the closure radius for our Magneticum sample using the same definition as that proposed by Ayromlou et al. (2022). To compare our results with their findings, we also consider the universal relation they proposed, which relates baryon fraction and closure radius:
 (10)
(10)
with β(z) defined as
 (11)
(11)
where α and γ are free parameters that we use to perform the fit on our simulations. Figure 10 shows a comparison between our findings and the results proposed by Ayromlou et al. (2022). In the left panel, we present the closure radius normalised to R500, c and as a function of baryon depletion factor Ybar for the four different suites of numerical simulations at redshift z ∼ 0.3. The results for Illustris-TNG, EAGLE, and SIMBA simulations are derived from the best-fit parameters of α and γ proposed by Ayromlou et al. (2022), while we perform the fitting procedure on our Magneticum sample. We obtain values of α = 26.48 and γ = −1.20, which also determine the redshift evolution of the β(z) parameter proposed in the right panel of Fig. 10. As also discussed by Ayromlou et al. (2022), different models adopted for the treatment of AGN feedback highly influence the position of the closure radius and cosmic time evolution of the β parameter. As the AGN model is one of the main differences between the four different simulations analysed, this also suggests that the AGN feedback in galaxy clusters and groups represents the major source of energy responsible for the redistribution of baryons in the halo environment. Moreover, the existence of a universal relation between closure radius and baryon fraction as proposed by Ayromlou et al. (2022) shows how crucial the next generation of X-ray observatories will be in observing the peripheries of clusters and groups and differentiating between the different AGN feedback models in terms of accuracy.
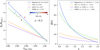 |
Fig. 10. Closure radius as a function of baryon depletion factor within R500, c and the β parameter as a function of redshift. Left: the dashed lines represent the results proposed by Ayromlou et al. (2022) for Illustris-TNG (orange), EAGLE (purple), and SIMBA (green) simulations computed for redshift z ∼ 0.3. The solid blue line shows the best-fit relation between closure radius and baryon depletion factor performed on our Magneticum sample at redhsift z ∼ 0.3. The coloured dots represent the median values of closure radius computed for the ten mass bins (according to the colour bar in the top right corner of the plot) at the same redshift, of namely z ∼ 0.3. Right: redshift evolution of the β parameter. The dashed lines show the results proposed by Ayromlou et al. (2022) for TNG (orange), EAGLE (purple), and SIMBA (green) simulations, whereas the solid blue line represents the findings we obtained as best fit on our Magneticum sample. |
5. Conclusions
In this work, we extend the analysis presented in Angelinelli et al. (2022) by constraining the redshift evolution –up to z = 2.8– of the distributions of baryons, gas, stars, and metallicity up to large distances (∼10R500, c) from the centres of halos. We base our analysis on a large set of galaxy clusters from the Magneticum simulation, and investigate the mass-dependent effects by further dividing our sample of 150 clusters into ten mass bins, and separately studying the evolving spatial distribution of the multi-phase baryonic mass across the sample. Our main findings can be summarised as follows.
-
In the central regions of galaxy clusters (r < R500, c), the baryon fraction shows a general decrease with redshift, with an approximately four times larger decrease for less massive objects than for massive ones (see Fig. 1 and Table A.1). The gas depletion parameter we recover inside R500, c is in agreement with observations of low-redshift halos (Eckert et al. 2021; Akino et al. 2022; see Fig. 2). At high redshift (z > 1.2), instead, the mass contribution of the cold gas phase (kT < 0.1 keV) is non-negligible. For instance, at z ∼ 2.8, the cold-gas component accounts for ∼20%−28% of the total gas, depending on the subsample mass. This leads to an increase in the total amount of gas, which is not well matched by the best fit suggested from low-z observations.
-
We measure a clear redshift evolution of the simulated radial behaviour of the baryon depletion parameter up to 10R500, c (see Fig. 3 and Table A.1). In agreement with Paper I, the closed-box assumption is valid at lower redshifts, but only in massive galaxy clusters and on radii greater than 5R500, c. On the other hand, the same condition is verified at higher redshifts independently of mass and for r ≥ 3R500, c. The radial trend of the gas depletion parameter shows that the differences between the least and most massive objects increase with cosmic time (Fig. 4). Even if the slope of the profiles is steeper for less massive objects, at all redshifts the scatter in the central regions in the most massive subsample is half that for less massive galaxy clusters. At larger radii (r ≥ 2R500, c), instead, the trend and absolute values of the gas depletion parameter are similar, regardless of mass or redshift. The hot-gas-phase depletion parameter increases radially with time at all masses (see Fig. 5). At high redshift, the hot gas phase is not enough to completely describe the gas depletion parameter. This means that the cold and X-ray unobserved gas components cannot be neglected in the computation of the cosmic baryon budget of high-redshift (z > 1.2) halos.
-
Previous works from Castro et al. (2021) and Ragagnin et al. (2022) show that AGN feedback phenomena affect the evolution of the baryon and gas fraction in galaxy cluster environments. We additionally studied the relation between feedback energy (Eq. (8)) and the depletion parameters (see Fig. 8 and Table 2), and find a high level of correlation with the evolution of both the cold gas phase and the stellar depletion parameter. On the other hand, the gas, the hot gas phase, and the gas metallicity are anti-correlated with the evolving feedback energy. The gas depletion parameter is the only parameter that also shows a dependency on the correlation with the mass of the galaxy clusters; this is expected because in less massive objects the contribution of cold gas is not negligible as it is for most massive systems. This trend appears consistent with early theoretical work by Lapi et al. (2005; see Fig. 9) suggesting that indeed the low redshift evolution of the gas depletion parameter is mainly driven by AGN feedback. The role of AGN feedback in numerical simulations is also discussed in Ayromlou et al. (2022). Studying Illustris-TNG, EAGLE, and SIMBA simulations, these latter propose a new characteristic scale based on the closure radius Rc, and a universal relation between Rc and fbar. After computing Rc for our sample, we test the universal relation proposed by Ayromlou et al. (2022) on the Magneticum simulation (see Fig. 10). We confirm that different models of AGN feedback implemented in different suites of numerical simulations lead to different findings for Rc and also determine different best-fit parameters for the universal relation between Rc and fbar. These results suggest the need for further observational investigations to find the model of AGN feedback that best reproduces the observational constraints. On the other hand, our analysis of gas metallicity and the stellar depletion parameter (see Figs. 6 and 7) suggests that the early enrichment scenario (see Biffi et al. 2017, 2018c) is likely to account for the aforementioned trend with mass and redshift. In the central regions of galaxy clusters, the redshift evolution of gas metallicity accounts for less than 20% in the least massive objects and less than 10% in the most massive ones. Moreover, the stellar depletion parameter decreases by a factor of 2, independently of the mass of the galaxy clusters. These trends suggest that recent star-formation processes make negligible contributions to the enrichment of the gas metallicity.
-
Finally, we extended the functional form proposed in Paper I by taking into account the dependences on the radius, mass, and redshift of the baryon, gas, and hot-gas-phase depletion parameters. The functional form is described by the formula:
 (12)
(12)where w = M500, c/5 × 1014 h−1 M⊙, x = r/R500, c, z is the redshift, and α, β, γ, δ, and ϵ are the free parameters. Our best-fit values (Table A.2) are able to provide a description with a deviation of about 2% for the baryon depletion parameter and within 3% for gas and hot-gas-phase parameters (see Fig. A.1).
These relations could be used as a proxy in current and future X-ray observations to provide useful constraints with which to test the different AGN feedback models used in different suites of numerical simulations.
See http://www.benediktdiemer.com/research/splashback/ for a complete bibliography about the splashback radius.
Acknowledgments
M.A. acknowledges the financial support from “Borsa Marco Polo – II tornata BIR 2021”. S.E. acknowledges the financial contribution from the contracts ASI-INAF Athena 2019-27-HH.0, “Attività di Studio per la comunità scientifica di Astrofisica delle Alte Energie e Fisica Astroparticellare” (Accordo Attuativo ASI-INAF n. 2017-14-H.0), INAF mainstream project 1.05.01.86.10, and from the European Union’s Horizon 2020 Programme under the AHEAD2020 project (grant agreement n. 871158). F.V. acknowledges financial support from the Horizon 2020 program under the ERC Starting Grant MAGCOW, no. 714196. K.D. acknowledges support by the COMPLEX project from the European Research Council (ERC) under the European Union’s Horizon 2020 research and innovation program grant agreement ERC-2019-AdG 882679. The Magneticum Simulations were carried out at the Leibniz Supercomputer Center (LRZ) under the project pr83li.
References
- Adhikari, S., Dalal, N., & Chamberlain, R. T. 2014, JCAP, 2014, 019 [Google Scholar]
- Akino, D., Eckert, D., Okabe, N., et al. 2022, PASJ, 74, 175 [NASA ADS] [CrossRef] [Google Scholar]
- Allen, S. W., Evrard, A. E., & Mantz, A. B. 2011, ARA&A, 49, 409 [Google Scholar]
- Angelinelli, M., Ettori, S., Dolag, K., Vazza, F., & Ragagnin, A. 2022, A&A, 663, L6 [NASA ADS] [CrossRef] [EDP Sciences] [Google Scholar]
- Asplund, M., Grevesse, N., Sauval, A. J., & Scott, P. 2009, ARA&A, 47, 481 [NASA ADS] [CrossRef] [Google Scholar]
- Aung, H., Nagai, D., & Lau, E. T. 2021, MNRAS, 508, 2071 [NASA ADS] [CrossRef] [Google Scholar]
- Ayromlou, M., Nelson, D., & Pillepich, A. 2022, MNRAS, submitted [arXiv:2211.07659] [Google Scholar]
- Beck, A. M., Murante, G., Arth, A., et al. 2016, MNRAS, 455, 2110 [Google Scholar]
- Bertschinger, E. 1985, ApJS, 58, 39 [Google Scholar]
- Biffi, V., Dolag, K., & Böhringer, H. 2013, MNRAS, 428, 1395 [Google Scholar]
- Biffi, V., Planelles, S., Borgani, S., et al. 2017, MNRAS, 468, 531 [Google Scholar]
- Biffi, V., Dolag, K., & Merloni, A. 2018a, MNRAS, 481, 2213 [Google Scholar]
- Biffi, V., Mernier, F., & Medvedev, P. 2018b, Space Sci. Rev., 214, 123 [NASA ADS] [CrossRef] [Google Scholar]
- Biffi, V., Planelles, S., Borgani, S., et al. 2018c, MNRAS, 476, 2689 [Google Scholar]
- Biffi, V., Dolag, K., Reiprich, T. H., et al. 2022, A&A, 661, A17 [Google Scholar]
- Bryan, G. L., & Norman, M. L. 1998, ApJ, 495, 80 [NASA ADS] [CrossRef] [Google Scholar]
- Castro, T., Borgani, S., Dolag, K., et al. 2021, MNRAS, 500, 2316 [Google Scholar]
- Chiu, I., Mohr, J., McDonald, M., et al. 2016, MNRAS, 455, 258 [NASA ADS] [CrossRef] [Google Scholar]
- Crain, R. A., Schaye, J., Bower, R. G., et al. 2015, MNRAS, 450, 1937 [NASA ADS] [CrossRef] [Google Scholar]
- Cui, W., Dave, R., Knebe, A., et al. 2022, MNRAS, 514, 977 [NASA ADS] [CrossRef] [Google Scholar]
- Davé, R., Anglés-Alcázar, D., Narayanan, D., et al. 2019, MNRAS, 486, 2827 [Google Scholar]
- Davies, J. J., Crain, R. A., Oppenheimer, B. D., & Schaye, J. 2020, MNRAS, 491, 4462 [NASA ADS] [CrossRef] [Google Scholar]
- Dehnen, W., & Aly, H. 2012, MNRAS, 425, 1068 [NASA ADS] [CrossRef] [Google Scholar]
- Dolag, K., & Stasyszyn, F. 2009, MNRAS, 398, 1678 [NASA ADS] [CrossRef] [Google Scholar]
- Dolag, K., Jubelgas, M., Springel, V., Borgani, S., & Rasia, E. 2004, ApJ, 606, L97 [NASA ADS] [CrossRef] [Google Scholar]
- Dolag, K., Vazza, F., Brunetti, G., & Tormen, G. 2005, MNRAS, 364, 753 [NASA ADS] [CrossRef] [Google Scholar]
- Dolag, K., Borgani, S., Murante, G., & Springel, V. 2009, MNRAS, 399, 497 [Google Scholar]
- Dolag, K., Komatsu, E., & Sunyaev, R. 2016, MNRAS, 463, 1797 [Google Scholar]
- Dolag, K., Mevius, E., & Remus, R.-S. 2017, Galaxies, 5, 35 [NASA ADS] [CrossRef] [Google Scholar]
- Duffy, A. R., Schaye, J., Kay, S. T., et al. 2010, MNRAS, 405, 2161 [NASA ADS] [Google Scholar]
- Eckert, D., Ettori, S., Coupon, J., et al. 2016, A&A, 592, A12 [NASA ADS] [CrossRef] [EDP Sciences] [Google Scholar]
- Eckert, D., Gaspari, M., Gastaldello, F., Le Brun, A. M. C., & O’Sullivan, E. 2021, Universe, 7, 142 [NASA ADS] [CrossRef] [Google Scholar]
- Eke, V. R., Cole, S., & Frenk, C. S. 1996, MNRAS, 282, 263 [CrossRef] [Google Scholar]
- Ettori, S. 2015, MNRAS, 446, 2629 [NASA ADS] [CrossRef] [Google Scholar]
- Ettori, S., Lovisari, L., & Eckert, D. 2023, A&A, 669, A133 [NASA ADS] [CrossRef] [EDP Sciences] [Google Scholar]
- Fabjan, D., Borgani, S., Tornatore, L., et al. 2010, MNRAS, 401, 1670 [Google Scholar]
- Gonzalez, A. H., Sivanandam, S., Zabludoff, A. I., & Zaritsky, D. 2013, ApJ, 778, 14 [Google Scholar]
- Gunn, J. E., Gott, J., & Richard, I. 1972, ApJ, 176, 1 [Google Scholar]
- Gupta, N., Saro, A., Mohr, J. J., Dolag, K., & Liu, J. 2017, MNRAS, 469, 3069 [Google Scholar]
- Henden, N. A., Puchwein, E., Shen, S., & Sijacki, D. 2018, MNRAS, 479, 5385 [CrossRef] [Google Scholar]
- Henden, N. A., Puchwein, E., & Sijacki, D. 2020, MNRAS, 498, 2114 [Google Scholar]
- Hirschmann, M., Dolag, K., Saro, A., et al. 2014, MNRAS, 442, 2304 [Google Scholar]
- Komatsu, E., Smith, K. M., Dunkley, J., et al. 2011, ApJS, 192, 18 [Google Scholar]
- Lapi, A., Cavaliere, A., & Menci, N. 2005, ApJ, 619, 60 [NASA ADS] [CrossRef] [Google Scholar]
- Lotz, M., Remus, R.-S., Dolag, K., Biviano, A., & Burkert, A. 2019, MNRAS, 488, 5370 [NASA ADS] [CrossRef] [Google Scholar]
- Lotz, M., Dolag, K., Remus, R.-S., & Burkert, A. 2021, MNRAS, 506, 4516 [NASA ADS] [CrossRef] [Google Scholar]
- Lovisari, L., Reiprich, T. H., & Schellenberger, G. 2015, A&A, 573, A118 [NASA ADS] [CrossRef] [EDP Sciences] [Google Scholar]
- Lustig, P., Strazzullo, V., Remus, R.-S., et al. 2023, MNRAS, 518, 5953 [Google Scholar]
- Mazzotta, P., Rasia, E., Moscardini, L., & Tormen, G. 2004, MNRAS, 354, 10 [NASA ADS] [CrossRef] [Google Scholar]
- Naab, T., & Ostriker, J. P. 2017, ARA&A, 55, 59 [Google Scholar]
- Nelson, D., Pillepich, A., Springel, V., et al. 2018, MNRAS, 475, 624 [Google Scholar]
- Nicastro, F., Kaastra, J., Krongold, Y., et al. 2018, Nature, 558, 406 [Google Scholar]
- Nugent, J. M., Dai, X., & Sun, M. 2020, ApJ, 899, 160 [NASA ADS] [CrossRef] [Google Scholar]
- Overzier, R. A. 2016, A&ARv, 24, 14 [Google Scholar]
- Pillepich, A., Nelson, D., Hernquist, L., et al. 2018, MNRAS, 475, 648 [Google Scholar]
- Planck Collaboration VI. 2020, A&A, 641, A6 [NASA ADS] [CrossRef] [EDP Sciences] [Google Scholar]
- Planck Collaboration XIII. 2016, A&A, 594, A13 [NASA ADS] [CrossRef] [EDP Sciences] [Google Scholar]
- Planck Collaboration Int. IV. 2013, A&A, 550, A131 [NASA ADS] [CrossRef] [EDP Sciences] [Google Scholar]
- Planelles, S., Borgani, S., Dolag, K., et al. 2013, MNRAS, 431, 1487 [Google Scholar]
- Ragagnin, A., Dolag, K., Moscardini, L., Biviano, A., & D’Onofrio, M. 2019, MNRAS, 486, 4001 [Google Scholar]
- Ragagnin, A., Andreon, S., & Puddu, E. 2022, A&A, 666, A22 [NASA ADS] [CrossRef] [EDP Sciences] [Google Scholar]
- Rasia, E., Lau, E. T., Borgani, S., et al. 2014, ApJ, 791, 96 [NASA ADS] [CrossRef] [Google Scholar]
- Robson, D., & Davé, R. 2023, MNRAS, 518, 5826 [Google Scholar]
- Schaye, J., Dalla Vecchia, C., Booth, C. M., et al. 2010, MNRAS, 402, 1536 [Google Scholar]
- Schaye, J., Crain, R. A., Bower, R. G., et al. 2015, MNRAS, 446, 521 [Google Scholar]
- Sorini, D., Davé, R., Cui, W., & Appleby, S. 2022, MNRAS, 516, 883 [CrossRef] [Google Scholar]
- Springel, V. 2005, MNRAS, 364, 1105 [Google Scholar]
- Springel, V. 2010, MNRAS, 401, 791 [Google Scholar]
- Springel, V., & Hernquist, L. 2002, MNRAS, 333, 649 [NASA ADS] [CrossRef] [Google Scholar]
- Springel, V., White, S. D. M., Tormen, G., & Kauffmann, G. 2001, MNRAS, 328, 726 [Google Scholar]
- Springel, V., Di Matteo, T., & Hernquist, L. 2005, MNRAS, 361, 776 [Google Scholar]
- Springel, V., Pakmor, R., Pillepich, A., et al. 2018, MNRAS, 475, 676 [Google Scholar]
- Steinborn, L. K., Dolag, K., Comerford, J. M., et al. 2016, MNRAS, 458, 1013 [Google Scholar]
- Sun, M., Voit, G. M., Donahue, M., et al. 2009, ApJ, 693, 1142 [NASA ADS] [CrossRef] [Google Scholar]
- Tornatore, L., Borgani, S., Springel, V., et al. 2003, MNRAS, 342, 1025 [NASA ADS] [CrossRef] [Google Scholar]
- Tornatore, L., Borgani, S., Dolag, K., & Matteucci, F. 2007, MNRAS, 382, 1050 [Google Scholar]
- Vazza, F., Dolag, K., Ryu, D., et al. 2011, MNRAS, 418, 960 [NASA ADS] [CrossRef] [Google Scholar]
- Vogelsberger, M., Genel, S., Springel, V., et al. 2014, MNRAS, 444, 1518 [Google Scholar]
- Voit, G. M. 2005, Rev. Mod. Phys., 77, 207 [Google Scholar]
- Walker, S., Simionescu, A., Nagai, D., et al. 2019, Space Sci. Rev., 215, 7 [Google Scholar]
- Wiersma, R. P. C., Schaye, J., Theuns, T., Dalla Vecchia, C., & Tornatore, L. 2009, MNRAS, 399, 574 [NASA ADS] [CrossRef] [Google Scholar]
- Young, S., Komatsu, E., & Dolag, K. 2021, Phys. Rev. D, 104, 083538 [NASA ADS] [CrossRef] [Google Scholar]
- Zhang, C., Churazov, E., Dolag, K., Forman, W. R., & Zhuravleva, I. 2020, MNRAS, 494, 4539 [NASA ADS] [CrossRef] [Google Scholar]
Appendix A: Depletion parameter estimations and fitting results
In Table A.1 we report the details of the values of the depletion parameters under investigation in the least and the most massive bins and at four radii (R500,c,3R500,c,5R500,c and 10R500,c) and for four different redshifts (2.79, 1.71, 0.67, and 0.25).
Depletion parameters computed on mass bins for four different redshifts and radii.
Table A.2 (see also Fig. A.1) provides the best-fit parameters obtained from the fitting function in Eq. 12. Following our previous work in Paper I, we limit our fitting to a radial range comparable to the one of present and near-future X-ray observations, focusing on the central regions of our analysis, from 0.5R500,c to 2.5R500,c. The functional form is able to well reproduce the behaviour of all the depletion parameters analysed, as shown by the  and values of the median and the maximum deviation of the model from the data (
 and emax, respectively). However, as already observed in PaperI, for the Ygas and Yhot here we note that our fitting procedure gives less reliable results than for Ybar. We use the dispersion around the mean profile as the weight to evaluate χ2.
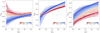 |
Fig. A.1. Radial profiles of baryon (left), gas (centre), and hot-gas-phase (right) depletion from 0.5R500,c to 2.5R500,c. The dashed lines represent the median profiles of each mass bin at each redshift according to the colour bar in the bottom right corner. The solid lines are the fit performed according to the functional form of Eq. 12, with the same colour scale as the median profiles. |
Best-fit parameters and related standard errors.
All Tables
Pearson correlation index of the redshift evolution computed between the feedback energy proxy and depletion parameters or metallicity inside R500, c for the least massive subsample, the most massive subsample, and the entire sample.
Depletion parameters computed on mass bins for four different redshifts and radii.
All Figures
|
Fig. 1. Baryon depletion parameter inside R500, c. The grey dots represent single galaxy clusters, identified by different markers, accordingly to the legend in the bottom left corner. Left: the coloured dots represent the median values computed in each of the mass bins of a single snapshot. The colour coding is given by the snapshot’s redshift, following the colourbar in the bottom right corner. Right: the coloured lines represent the redshift evolution of each mass bin. The colour coding is given by the mass bin, following the colourbar in the bottom right corner. |
| In the text | |
|
Fig. 2. Gas depletion parameter (left) and hot-gas-phase depletion parameter (right) inside R500, c. The grey dots represent single galaxy clusters, and these are identified by the different markers listed in the legend in the bottom right corner. The coloured dots represent the median values computed in each of the mass bins of a single snapshot. The colour coding is given by the snapshot’s redshift following the colour bar in the top left corner. The solid lines (and related shadow regions) represent the fits proposed by Eckert et al. (2021; |
| In the text | |
|
Fig. 3. Radial profiles of the baryon-depletion parameter, from 0.5R500, c to 10R500, c, for the least massive bin (dashed lines) and most massive bin (solid lines). The lines represent the median profiles at four different redshifts, for which the colour code is shown in the bottom right corner (see Table A.1 for the definition of the mass ranges). |
| In the text | |
|
Fig. 4. Radial profiles of gas depletion parameter, from 0.5R500, c to 10R500, c, for the less massive bin (dashed lines) and most massive one (solid lines). The lines represent the median profiles at four different redshifts, for which the colour code is shown in the bottom right corner (see Table A.1 for the definition of the mass ranges). |
| In the text | |
|
Fig. 5. Radial profiles of the depletion parameter for the hot gas phase, from 0.5R500, c to 10R500, c, for the less massive bin (dashed lines) and most massive bin (solid lines). The lines represent the median profiles at four different redshifts, for which the colour code is shown in the top right corner (see Table A.1 for the definition of the mass ranges). |
| In the text | |
|
Fig. 6. Radial profiles of gas metallicity (in Solar units) from 0.5R500, c to 10R500, c for the least massive bin (dashed lines) and most massive bin (solid lines). The lines represent the median profiles at four different redshifts, for which the colour code is shown in the top right corner (see Table A.1 for the definition of the mass ranges). |
| In the text | |
|
Fig. 7. Radial profiles of stellar depletion parameter from 0.5R500, c to 10R500, c for the least massive bin (dashed lines) and most massive bin (solid lines). The lines represent the median profiles at four different redshifts, for which the colour code is shown in the top right corner (see Table A.1 for the definition of the mass ranges). |
| In the text | |
|
Fig. 8. Redshift evolution in the range 0.2 ≲ z ≲ 2 in terms of feedback, depletion parameters, and metallicity and their correlations inside R500, c. Left: median values of depletion parameters, metallicity, and feedback energy proxy as a function of redshift. The different lines (explained in the inset at the bottom) represent the median values computed for the entire galaxy cluster sample at each redshift. Right: pearson correlation index of the redshift evolution computed between the feedback energy proxy and depletion parameters or metallicity. The coloured dots represent the median values computed in each mass bin (following the colour coding shown by the colour bar in the middle of the plot), while the dots identified by different markers (explained in the legend in the middle of the plot) show the median values computed for the whole sample. |
| In the text | |
|
Fig. 9. Time evolution of feedback energy and mass depletion inside R500, c. Top: the dotted line represents the time-integrated ratio between feedback energy and the thermal energy of the system (“dE/E”), and the solid line shows the mass depletion computed as the difference between the baryon fraction in two consecutive time steps (“dM/M − Data”), the dashed line represents the expected mass depletion computed as |
| In the text | |
|
Fig. 10. Closure radius as a function of baryon depletion factor within R500, c and the β parameter as a function of redshift. Left: the dashed lines represent the results proposed by Ayromlou et al. (2022) for Illustris-TNG (orange), EAGLE (purple), and SIMBA (green) simulations computed for redshift z ∼ 0.3. The solid blue line shows the best-fit relation between closure radius and baryon depletion factor performed on our Magneticum sample at redhsift z ∼ 0.3. The coloured dots represent the median values of closure radius computed for the ten mass bins (according to the colour bar in the top right corner of the plot) at the same redshift, of namely z ∼ 0.3. Right: redshift evolution of the β parameter. The dashed lines show the results proposed by Ayromlou et al. (2022) for TNG (orange), EAGLE (purple), and SIMBA (green) simulations, whereas the solid blue line represents the findings we obtained as best fit on our Magneticum sample. |
| In the text | |
|
Fig. A.1. Radial profiles of baryon (left), gas (centre), and hot-gas-phase (right) depletion from 0.5R500,c to 2.5R500,c. The dashed lines represent the median profiles of each mass bin at each redshift according to the colour bar in the bottom right corner. The solid lines are the fit performed according to the functional form of Eq. 12, with the same colour scale as the median profiles. |
| In the text | |
Current usage metrics show cumulative count of Article Views (full-text article views including HTML views, PDF and ePub downloads, according to the available data) and Abstracts Views on Vision4Press platform.
Data correspond to usage on the plateform after 2015. The current usage metrics is available 48-96 hours after online publication and is updated daily on week days.
Initial download of the metrics may take a while.