Fig. 10.
Download original image
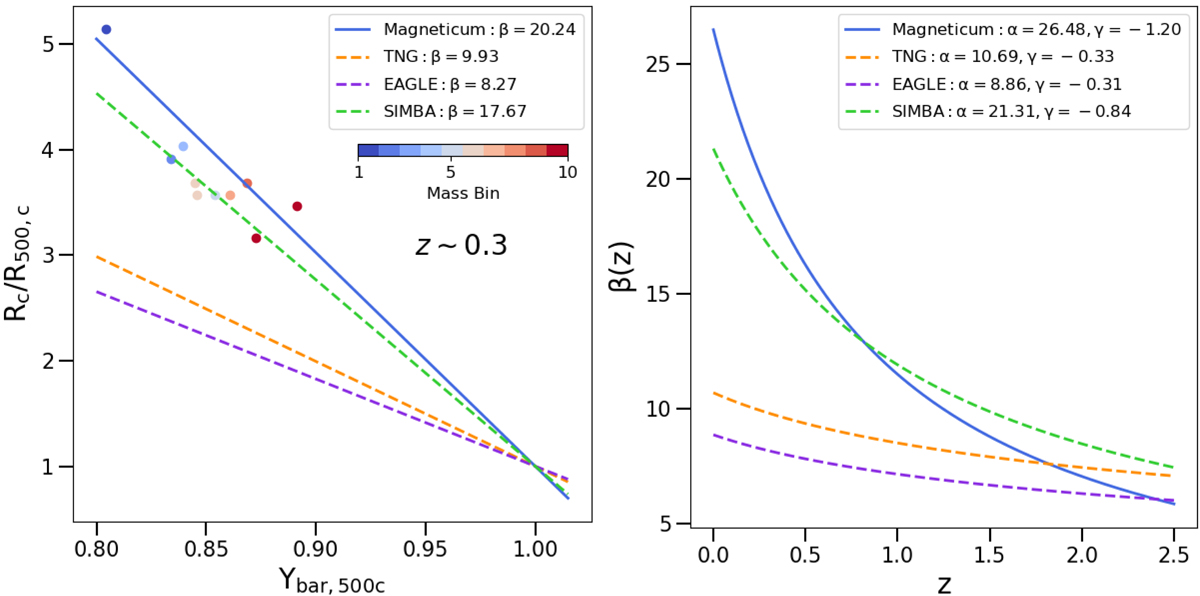
Closure radius as a function of baryon depletion factor within R500, c and the β parameter as a function of redshift. Left: the dashed lines represent the results proposed by Ayromlou et al. (2022) for Illustris-TNG (orange), EAGLE (purple), and SIMBA (green) simulations computed for redshift z ∼ 0.3. The solid blue line shows the best-fit relation between closure radius and baryon depletion factor performed on our Magneticum sample at redhsift z ∼ 0.3. The coloured dots represent the median values of closure radius computed for the ten mass bins (according to the colour bar in the top right corner of the plot) at the same redshift, of namely z ∼ 0.3. Right: redshift evolution of the β parameter. The dashed lines show the results proposed by Ayromlou et al. (2022) for TNG (orange), EAGLE (purple), and SIMBA (green) simulations, whereas the solid blue line represents the findings we obtained as best fit on our Magneticum sample.
Current usage metrics show cumulative count of Article Views (full-text article views including HTML views, PDF and ePub downloads, according to the available data) and Abstracts Views on Vision4Press platform.
Data correspond to usage on the plateform after 2015. The current usage metrics is available 48-96 hours after online publication and is updated daily on week days.
Initial download of the metrics may take a while.