Fig. 2.
Download original image
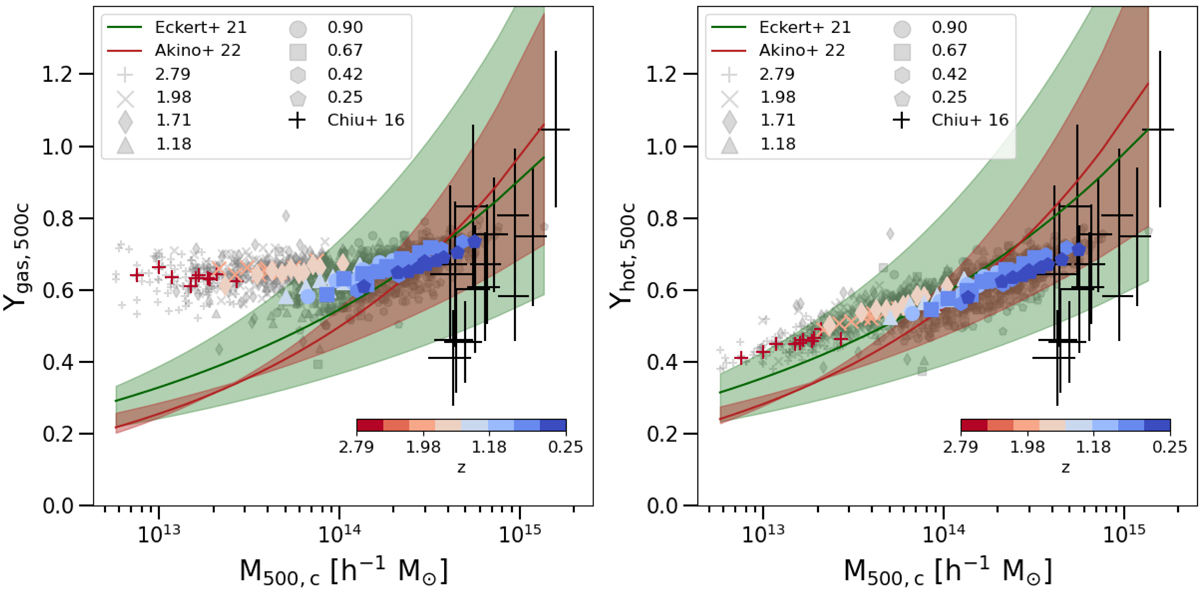
Gas depletion parameter (left) and hot-gas-phase depletion parameter (right) inside R500, c. The grey dots represent single galaxy clusters, and these are identified by the different markers listed in the legend in the bottom right corner. The coloured dots represent the median values computed in each of the mass bins of a single snapshot. The colour coding is given by the snapshot’s redshift following the colour bar in the top left corner. The solid lines (and related shadow regions) represent the fits proposed by Eckert et al. (2021; ![]() , shown in green) and Akino et al. (2022;
, shown in green) and Akino et al. (2022; ![]() , shown in red). The black crosses represent the fgas estimates of Chiu et al. (2016).
, shown in red). The black crosses represent the fgas estimates of Chiu et al. (2016).
Current usage metrics show cumulative count of Article Views (full-text article views including HTML views, PDF and ePub downloads, according to the available data) and Abstracts Views on Vision4Press platform.
Data correspond to usage on the plateform after 2015. The current usage metrics is available 48-96 hours after online publication and is updated daily on week days.
Initial download of the metrics may take a while.