Fig. A.1.
Download original image
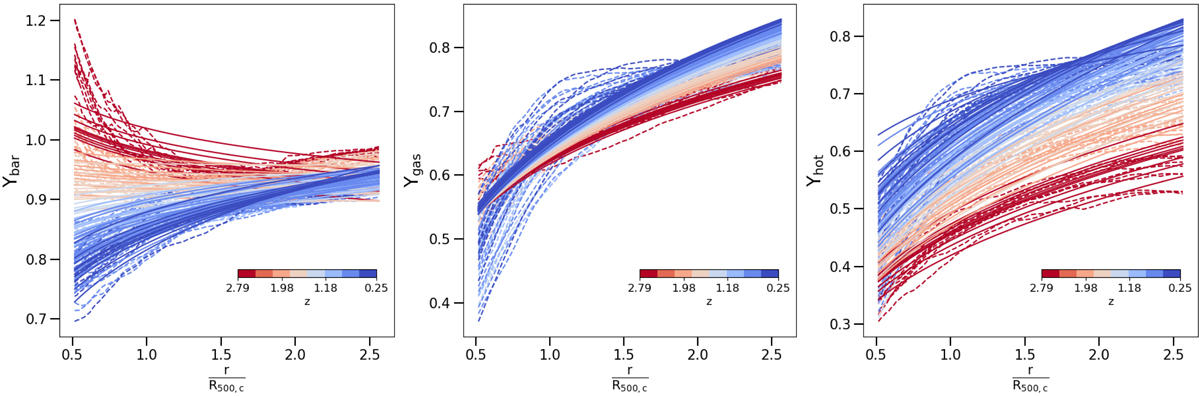
Radial profiles of baryon (left), gas (centre), and hot-gas-phase (right) depletion from 0.5R500,c to 2.5R500,c. The dashed lines represent the median profiles of each mass bin at each redshift according to the colour bar in the bottom right corner. The solid lines are the fit performed according to the functional form of Eq. 12, with the same colour scale as the median profiles.
Current usage metrics show cumulative count of Article Views (full-text article views including HTML views, PDF and ePub downloads, according to the available data) and Abstracts Views on Vision4Press platform.
Data correspond to usage on the plateform after 2015. The current usage metrics is available 48-96 hours after online publication and is updated daily on week days.
Initial download of the metrics may take a while.