Fig. 8.
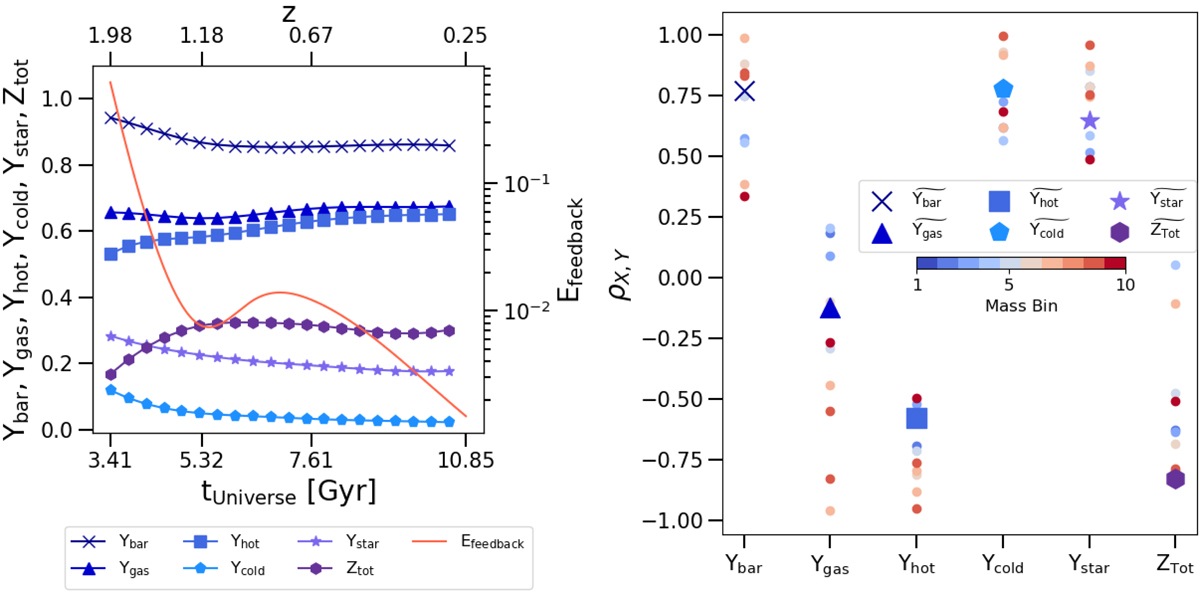
Download original image
Redshift evolution in the range 0.2 ≲ z ≲ 2 in terms of feedback, depletion parameters, and metallicity and their correlations inside R500, c. Left: median values of depletion parameters, metallicity, and feedback energy proxy as a function of redshift. The different lines (explained in the inset at the bottom) represent the median values computed for the entire galaxy cluster sample at each redshift. Right: pearson correlation index of the redshift evolution computed between the feedback energy proxy and depletion parameters or metallicity. The coloured dots represent the median values computed in each mass bin (following the colour coding shown by the colour bar in the middle of the plot), while the dots identified by different markers (explained in the legend in the middle of the plot) show the median values computed for the whole sample.
Current usage metrics show cumulative count of Article Views (full-text article views including HTML views, PDF and ePub downloads, according to the available data) and Abstracts Views on Vision4Press platform.
Data correspond to usage on the plateform after 2015. The current usage metrics is available 48-96 hours after online publication and is updated daily on week days.
Initial download of the metrics may take a while.