Fig. 9.
Download original image
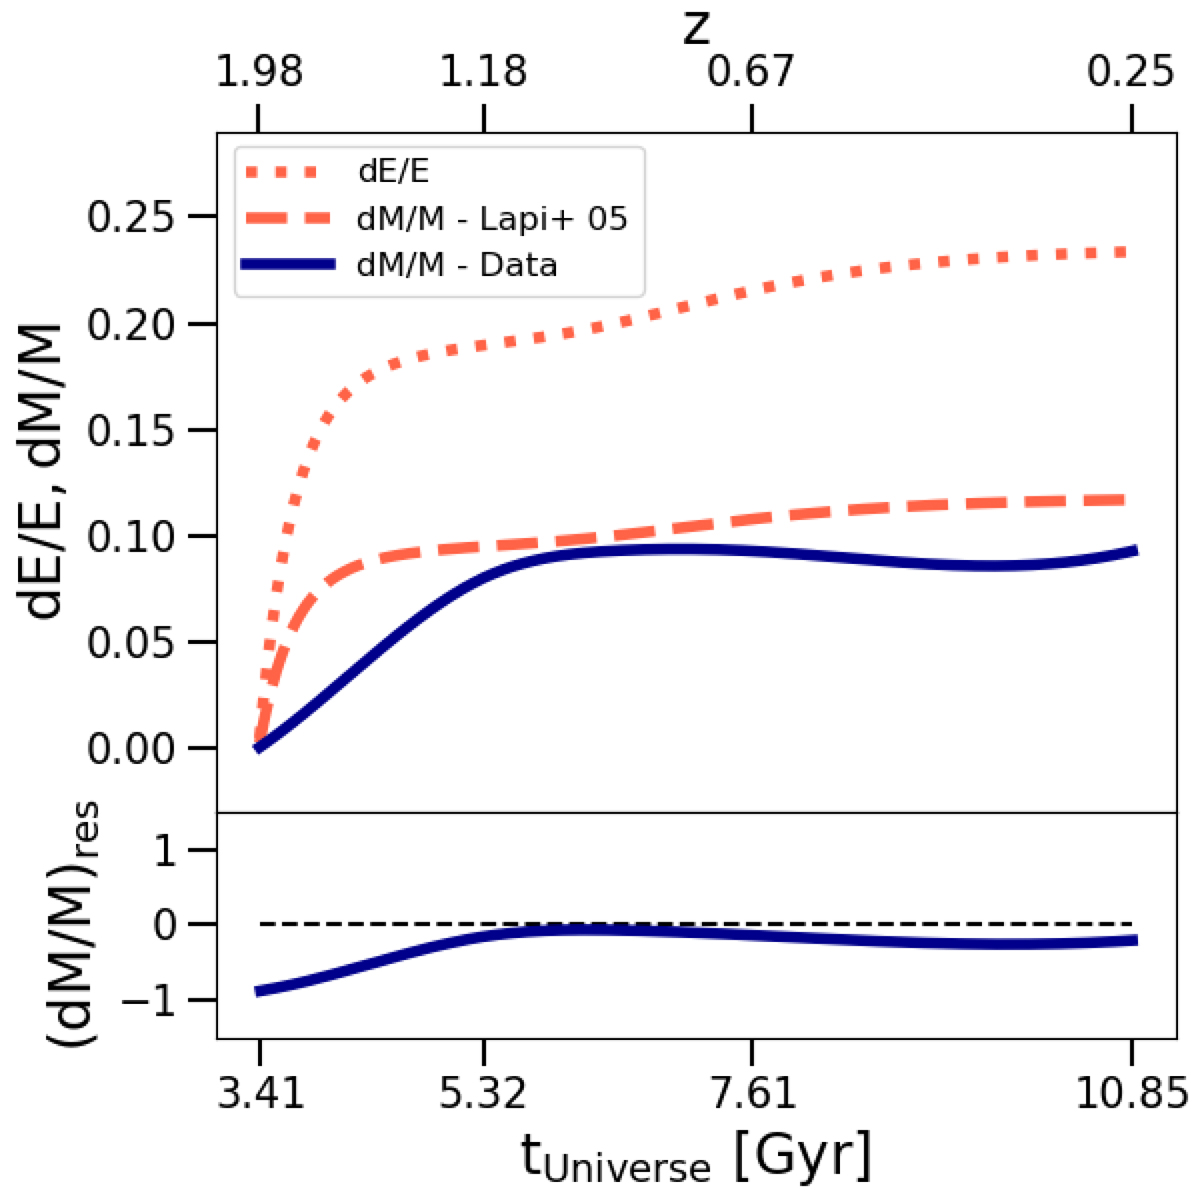
Time evolution of feedback energy and mass depletion inside R500, c. Top: the dotted line represents the time-integrated ratio between feedback energy and the thermal energy of the system (“dE/E”), and the solid line shows the mass depletion computed as the difference between the baryon fraction in two consecutive time steps (“dM/M − Data”), the dashed line represents the expected mass depletion computed as ![]() , as proposed by Lapi et al. (2005; “dM/M − Lapi + 05”). The lines represent the median trends computed over the whole galaxy cluster sample. Bottom: the line shows the residuals of mass depletion computed as ((dM/M)Data − (dM/M)Lapi + 05)/(dM/M)Lapi + 05.
, as proposed by Lapi et al. (2005; “dM/M − Lapi + 05”). The lines represent the median trends computed over the whole galaxy cluster sample. Bottom: the line shows the residuals of mass depletion computed as ((dM/M)Data − (dM/M)Lapi + 05)/(dM/M)Lapi + 05.
Current usage metrics show cumulative count of Article Views (full-text article views including HTML views, PDF and ePub downloads, according to the available data) and Abstracts Views on Vision4Press platform.
Data correspond to usage on the plateform after 2015. The current usage metrics is available 48-96 hours after online publication and is updated daily on week days.
Initial download of the metrics may take a while.