| Issue |
A&A
Volume 671, March 2023
|
|
|---|---|---|
| Article Number | A148 | |
| Number of page(s) | 17 | |
| Section | Catalogs and data | |
| DOI | https://doi.org/10.1051/0004-6361/202245587 | |
| Published online | 21 March 2023 | |
Identification of late-type Class I stars using Gaia DR3 Apsis parameters
Freelancer,
Gartenstrasse 7,
14482
Potsdam, Germany
e-mail: This email address is being protected from spambots. You need JavaScript enabled to view it.
; This email address is being protected from spambots. You need JavaScript enabled to view it.
Received:
30
November
2022
Accepted:
13
January
2023
Abstract
Aims. We examined the Gaia DR3 GSP-Phot and GSP-Spec parameters of known K- and M-type stars of Class I luminosity to make a comparison with the parameters collected from the literature to assess their accuracy and their potential in setting stellar classifications of intrinsically bright late-types that have been unknown thus far. Gaia DR3 GSP-Phot and GSP-Spec parameters were generated by the astrophysical parameters inference software (Apsis).
Methods. In the Gaia DR3 catalog, there are about 40,000 entries with Apsis parameters that are similar to those of known red supergiants (RSGs), good parallaxes, and infrared 2MASS and WISE data. In using parallactic distances, infrared photometry, and variability information, only 203 new entries were found with luminosities and temperatures similar to that of known RSGs and G-band amplitudes smaller than 0.5 mag. Their low-resolution BP/RP spectra were compared with an empirically built spectral library of BP/RP spectra of known bright late-type stars, including C-rich, S-type, O-rich asymptotic giant branch stars (AGBs) and RSGs, to obtain their spectral types.
Results. Among them, 15 S-type stars were identified based on peculiar absorption features attributed to ZrO and LaO visible in their BP/RP spectra, along with 1 S/C star and 9 C-rich stars by their strong CN absorption bands. K- and M-types can be reproduced with an accuracy of two subtypes. In addition, 20 new RSGs have been confirmed, of which 6 have bolometric magnitudes that are brighter than those of the AGB limit: 2MASS J21015501+4517205, 2MASS J16291280-4956384, 2MASS J10192621-5818105, 2MASS J20230860+3651450, 2MASS J17084131−4026595, and 2MASS J16490055−4217328. The flag for C-rich stars of the Gaia DR3 LPV pipeline is erroneously positive for some RSGs and, thus, a visual inspection of the BP/RP spectra is mandatory.
Key words: stars: evolution / supergiants / stars: massive / techniques: spectroscopic / stars: late-type / Galaxy: stellar content
On February 1st, 2023 Maria moved to Bologna to start a contract with the University and Observatory of Bologna.
© The Authors 2023
 Open Access article, published by EDP Sciences, under the terms of the Creative Commons Attribution License (https://creativecommons.org/licenses/by/4.0), which permits unrestricted use, distribution, and reproduction in any medium, provided the original work is properly cited.
This article is published in open access under the Subscribe to Open model. This email address is being protected from spambots. You need JavaScript enabled to view it. to support open access publication.
1 Introduction
The designation of “late-type stars” refers to bright, evolved stars that are cooler than ≈4500 K. Such stars are divided into red supergiants (RSG) and asymptotic giant branch stars (AGB). Generally, RSGs are characterized by masses from 9 to 40 M⊙ and they do not have a degenerate state in their core and they are continuing to burn He – while AGB stars have masses of <9 M⊙ and are characterized by two burning shells: an inner He shell and an outer H shell; while the core of CO is in an electron-degenerate state. Also, AGB stars experience complex interactions between the two burning shells and matteris dredge-up to the surface, thereby changing their stellar chemistry. Those with masses from 1 to 5 M⊙ evolve from an O-rich atmosphere ([C/O] < 1) to a C-rich one ([C/O] < 1). S-type stars are in a hybrid state, transiting toward a C-rich chemistry. Late-type stars are often also named with terms that indicate their variability type, for example, Mira, semi-regular, irregular, long period variables (LPV), and large amplitude variables (LAV), or their envelope types (e.g., OH/IR stars, SiO masing stars, etc.).
In the inner Galaxy, uncertainties on distances and dust obscuration hamper the detection of RSGs. The ages of RSGs range from 8 to 30 Myr, while AGBs range from 30 Myr to 12 Gyr, but their properties are similar. Currently, about 600 Galactic stars are known to be probable RSGs1 and to expand this number, a careful analysis of dissimilarities between AGBs and RSGs is required. This is an imperative requirement for understanding the history and morphology of the Milky Way, since, in a barred gravitational potential, their spatial distributions are predicted to differ. It is misleading to talk about initial mass functions of late-type stars and spatial distributions without being able to distinguish RSGs from AGBs.
For a compilation of about 1400 stars listed in the literature as class I K-type and M-type stars, namely, O-rich stars (Messineo & Brown 2019), 889 have good Gaia DR2 parallaxes and 966 in EDR3. With estimates of luminosity and effective temperature, Teff, the authors found a tail of 110 stars brighter than the AGB luminosity limit (Mbol = −7.1 mag). Furthermore, at least 49% of the stars in the sample are brighter than Mbol = −5.0mag and earlier than M4, which means they are more massive than 7 M⊙ (Messineo & Brown 2019).
The new DR3 release of Gaia2 includes the first release of data from the two spectrographs on board and variability data. The new data may allow us to refine the Galactic catalog of RSGs. The periods of RSGs range from 100 days to 1000 days, similarly to Mira AGB stars, but Miras have larger amplitudes (Ampl ≳ 0.8 in G-band, e.g., Lebzelter et al. 2023; Messineo 2022).
The Gaia DR3 release (1.5 billion sources) delivers Teff values, spectral types, and gravity of 470 million stars with low-resolution BP/RP spectra, which are computed with the astrophysical parameters inference system (Apsis) pipeline. For 5.5 million stars, it also delivers parameters and chemical abundances from the RVS spectra. In principle, cool stars with [M/H] < 0.5 dex and log(g) < 0.7 cm s−2 could be extracted from the Gaia DR3 catalog as candidate RSGs. However, the parameters from Apsis are not optimized for AGB and RSG stars because circumstellar envelopes and compositional changes due to dredge-up are not considered.
In this work, parameters of known bright O-rich stars taken from the literature are compared with those estimated by Gaia DR3 (e.g., Teff values, gravity, Ampl values) and their BP/RP spectra are analyzed for classification purposes. In Sect. 2, the sample of stars is presented. The parameters from the Apsis pipeline are described in Sect. 3, and the parameters from the Gaia variable catalog are given in Sect. 4. In Sect. 5, we describe the molecular signatures used to distinguish O-rich stars from C-rich and S-type stars visible in the BP/RP spectra. In Sect. 6, the Apsis parameters used to extract a new sample of bright late-type stars are presented and their low-resolution BP/RP spectra are analyzed to identify C-rich, S-type, O-rich AGBs, and RSGs. Finally, our summary is given in Sect. 7.
2 The Galactic sample of class I K-M stars
The sample collected by Messineo & Brown (2019) contains 1406 stars which were reported at least once in the literature as K-M class I stars. Six stars that had previously been included were discarded3 and 121 new entries were added from the updated catalog of Skiff (2014, updates from 2020 in the Centre de Données astronomiques de Strasbourg, CDS). The number of sampled stars is 1521. The catalog is expected to be made of evolved, bright late-type stars (RSGs, O-rich AGBs, and red giants).
Among these stars, only 1060 sources have good Gaia DR3 parallaxes (ϖ, values), where good means  larger than 4. The external parallactic errors, σϖ (est), are calculated with the formula from Maíz Apellániz et al. (2021), which is a function of the G-band magnitude and of the normalized unit weight error (RUWE). The ϖ values from the EDR3 to DR3 release are unchanged. The Gaia EDR3 distances from Bailer-Jones et al. (2021) are here assumed.
The compiled infrared catalog contains data from the Two Micron All Sky Survey (2MASS), Deep near-infrared survey of the Southern Sky (DENIS), the Midcourse Space Experiment (MSX), the Wide-field Infrared Survey Explorer (WISE), Galactic Legacy Infrared Midplane Survey Extraordinaire (GLIMPSE), and MIPSGAL. The spectral types, estimates of interstellar extinction, and bolometric magnitudes are as described in Messineo & Brown (2019, and references therein). The authors inferred the stellar Teff values by assuming the temperature scale by Levesque et al. (2005) and the Mbol values using the dereddened KS magnitudes and the bolometric corrections  of Levesque et al. (2005), as well as by estimating the total flux enclosed under the infrared stellar energy distribution. The interstellar extinction in KS-band,
  , is calculated with the 2MASS JHK magnitudes and the intrinsic colors for RSGs by Koornneef (1983). The stars in areas A & B of Messineo & Brown (2019), with BP/RP spectra have
  values lower than 0.72 mag or AV = 7.82 mag. The selective extinction ratios used are those given in Messineo et al. (2005) for a power law with an index of −1.9.
In the following sections, late-type stars with different luminosity and Teff ranges are mentioned as belonging to “areas” of the luminosity versus Teff diagram, following the definition of Messineo & Brown (2019)4. Typical Galactic RSGs are found to populate areas A and B (stars brighter than Mbol < −5 mag and with a spectral type not later than M4).
3 Apsis parameters of class I K-M stars
The Gaia DR3 release presents two sets of spectroscopic parameters: those from the GSP-Phot module (low-resolution spectra) and those from the GSP-Spec module (high-resolution spectra).
3.1 GSP-Phot
The GSP-Phot module releases Teff, gravity, and metallicities from the low-resolution BP/RP spectra for 283 (out of 1060) stars included in the sample. This number decreases to 159 when considering only the 713 stars with  and luminosity estimates above the tip of the red giant branch (i.e., located in areas A, B, C, D, E of the color-magnitude diagram, CMD, Messineo & Brown 2019).
For cool evolved stars, the Apsis GSP-Phot module uses models from the PHOENIX or MARCS libraries to find the best low-resolution matching spectrum and to obtain Teff, gravity (log(g)), and metallicity ([Fe/H]; Fouesneau et al. 2023, and references therein). The fit is based on the shape of the average spectrum and stars are all assumed to be nonvariable. However, average spectra-based analyses of Mira AGB stars that often report optical brightness variations greater than 8 mag come across as a gross simplification. Furthermore, the fit strongly depends on the treatment of interstellar extinction, which is self-derived from the Gaia data. On the contrary, G-band variations of RSGs are typically smaller than 0.5 mag.
The goodness-of-fit score for the adopted library spectrum (logposterior_gspphot) and the goodness-of-fit score for models with two unresolved components (logposterior_msc) have low values. A lower value indicates a lower-quality fit. The log-posterior_gspphot values range from −31895 to 32502. The logposterior_msc values range from −1.09e7 to −85 378, while Fouesneau et al. (2023) suggests using values > − 1000. In conclusion, due to large variability and quality of the fit, the Gaia DR3 Apsis pipeline performance for the BP/RP spectra of bright late-type stars is poorer than for the bulk of low luminosity cool stars.
3.1.1 Temperatures and extinction
In Fig. 1, for the 159 stars above the tip of the red giant branch, the GSP-Phot Teff values are compared with those adopted in Messineo & Brown (2019) by assuming an initial class I. For the bulk of low gravity stars (log(g) < 0.5), there is a good agreement between the literature Teff values and the new GSP-Phot Teff with a mean delta of 105 K and a standard deviation of 82 K (57 out of 82 objects). These are mostly M-type located at extinction below AV = 2 mag. With increasing extinction (distance) stellar Teff values may appear higher, because an overestimated extinction yields a warmer temperature. Indeed, the Gaia self-derived extinction values appear higher than those inferred from infrared by Messineo & Brown (2019), roughly by a factor 1.5. In Fig. 1, the Gaia A0 parameter that is the line-of-sight monochromatic extinction at 541.4 nm inferred by the GSP-Phot pipeline (Andrae et al. 2023) using the law of Fitzpatrick (1999), is plotted versus the  mag of Messineo et al. (2005). A different way of reading this bias is that the bright M-type supergiants (σ(Temp) = 72 K) delivered by the GSP-Phot module are mostly located at low extinction, as shown in Fig. 1. For lower-mass stars, a similar degeneracy between temperature and extinction is documented in the study of Andrae et al. (2023, their Fig. 7).
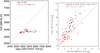 |
Fig. 1 Gaia GSP-Phot Teff and A0 (0.55 nm) extinction values of stars in Messineo & Brown (2019, areas A and B). Leftpαnel: Teff values adopted from literature by Messineo & Brown (2019) versus the Teff from the Gaia DR3 BP/RP spectra. Data points in red indicate log(g) < 0.5. Right panel: Gaia GSP-Phot A0 values versus the A0 values |

3.1.2 Gravity
In Fig. 2, the GSP-Phot log(g) values of stars with luminosities above the tip of the red giant branch are compared with those estimated using the relation between log(g) and luminosity by Messineo et al. (2021). There is a mean shift of −0.05 and σ = 0.36.
The gravity of known RSGs ranges from −0.7 to 0.7 (Messineo et al. 2021). A total of 114 (72%) stars, out of the 159 sampled stars above the tip of the red giant branch and with available Gaia BP/RP spectra, have GSP-Phot log(g) < 0.7.
3.1.3 Metallicity
The metallicity of known RSGs ranges from −0.5 to 0.5, as inferred from values collected from the literature (Messineo et al. 2021). There are 148 GSP-Phot entries with [Fe/H] > −0.5 dex matching stars from Messineo & Brown (2019) brighter than the tip of the red giant branch and which constitute 93% of the available matches, and this percentage remains 93% in areas A and B.
Fouesneau et al. (2023) warn about systematics in the GSP-Phot [Fe/H], which should therefore only be used as indicative. Indeed, for low gravity stars, it appears that the metallicity estimated with the GSP-Phot module is poorly determined, and for members of open clusters, offsets up to 1 dex were measured (Andrae et al. 2023). For 23 bright late-type stars with both GSP-Phot [Fe/H] values and [Fe/H] values from the literature, and with  , an average difference of 0.1 dex is obtained with σ = 0.25 dex, with a maximum difference of 0.68 dex (see Fig. 3).
3.2 GSP-Spec
The Apsis GSP-Spec module performs the analysis of a normalized spectrum and, therefore, the measured quantities are independent of the stellar continuum. Parameters inferred from spectra taken with the Gaia high-resolution spectrograph (R = 11 500) were retrieved for 336 catalog stars, 325 of which are of good parallaxes  . However, they are mostly giants (class F of Messineo & Brown 2019). Only 72 stars are brighter than the tip of the red giant branch. The retrieved entries were selected to have the first nine digits of the GSP-Spec quality flag smaller than unity or equal to it, while the 10, 11, and 12 digits were required to be null (Recio-Blanco et al. 2023). This means ΔTeff < 500 K, Δ log(g) < 1 dex, and Δ[M/H] < 0.5 dex.
3.2.1 Temperature
In Fig. 4, for the 72 data points brighter than the tip of the red giant branch, Teff values listed in Messineo & Brown (2019) are compared with those estimated by the Gaia GSP-Spec module. There is an average difference of 119 K with σ = 124 K.
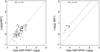 |
Fig. 2 log(g) values given by Gaia DR3 pipeline compared with those estimated from the stellar luminosities, for stars in Messineo & Brown (2019, areas A and B). Left panel: log(g) from the luminosity relation derived by Messineo et al. (2021) versus GSP-Phot log(g). Right panel: log(g) from the luminosity relation versus Gaia GSP-Spec log(g). Only data points with good distance and from areas A and B of Messineo & Brown (2019) are plotted. The dashed line is the equity line, while the dashed-dotted line has been shifted by −0.8 dex. |
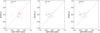 |
Fig. 3 [Fe/H] values from spectroscopic published works versus the [Fe/H] values inferred by the GSP-Phot and GSP-Spec module. The red filled circles are data points located in the areas A and B of the Luminosity–Teff diagram of Messineo & Brown (2019). Encircled data points are from the works of Davies et al. (2010) and Gazak et al. (2014). Left panel: [Fe/H] values from the literature versus those inferred from GSP-Phot module. Middle panel: [Fe/H] values from the literature versus the [M/H] values inferred from GSP-Spec. Right panel: [Fe/H] values from the literature versus the [Fe/H] values inferred from GSP-Spec [M/H] and GSP-Spec [α/Fe] using the formula of Ferraro et al. (1999). |
3.2.2 Gravity
Seventeen data points with good quality GSP-Spec log(g) are located in areas A and B of Messineo & Brown (2019), while 9 have a luminosity-inferred log(g) < 0.5 dex; the average difference between their GSP-Spec log(g) and the luminosity-inferred log(g) is −0.5 dex with σ = 1.65 dex. In Fig. 2, it appears that the GSP-Spec log(g) values are systematically lower.
3.2.3 Metallicity
The GSP-Spec [M/H] value is a measure of the stellar total metallicity (Fe and α elements) and the GSP-Spec [α/Fe] is the corresponding α enhancement. On the basis of chemical Galactic evolution studies, the following is usually assumed: [α/Fe] = 0 for [M/H] > 0 dex, [α/Fe] = +0.4 for [M/H] < −1 dex, and [α/Fe] = +0.4 × [M/H] for −1 < [M/H] < 0 dex. The grid of the synthetic spectra was centered on these canonical values (Recio-Blanco et al. 2023).
In the sample, there are 25 data points with available GSP-Spec [M/H] values as well as [Fe/H] values from the literature. Estimates of [Fe/H] are obtained from GSP-Spec [M/H] and GSP-Spec [α/Fe] with the Eq. (1) of Ferraro et al. (1999), and eventually compared with the literature values in Fig. 3. An average difference of −0.24 is measured and σ = 0.25 dex; the maximum deviation is 0.78 dex. From Fig. 3, however, it appears that the differences are systematically bigger when GSP-Spec [Fe/H] decreases. Indeed, for GSP-Spec [M/H] > −0.2 dex the average difference of −0.04 dex and σ = 0.16 dex; while for GSP-Spec [M/H] < −0.2 dex the average difference of −0.40 dex and σ = 0.18 dex. It appears that the GSP-Spec module does not deliver super-solar metallicity for bright late-type stars.
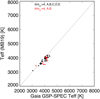 |
Fig. 4 Teff values from Messineo & Brown (2019) versus the Teff values inferred from the GSP-Spec module. Only stars with luminosity above the tip of the red giant branch and with |

4 Amplitudes of class I K-M stars
Among the 1,060 catalog stars with good parallaxes, there are period estimates for 87 long-period variables (Lebzelter et al. 2023), of which 82 variables are located among the 713 stars brighter than the tip of the red giant branch and 71 in areas A and B from Messineo & Brown (2019).
The Ampl values of variable stars is an important parameter, which allows us to separate variable RSGs and Mira AGBs. Typically, RSGs have Ampl <0.8 in G-band, while Mira AGBs from ≈0.8 to 8 mag (e.g., Lebzelter et al. 2023; Messineo 2022). In Fig. 5, the Gaia DR3 period (Per) values are plotted versus the Gaia DR3 amplitude (Ampl) values. Per values range from about 42 to 983 days. The Ampl values mildly correlate with the Per values and are mostly smaller than G Ampl <0.5 mag. In the Mbol versus Teff diagram, the periodic variables are marking the brightest end of the stellar distribution. A few higher amplitudes are also present (G Ampl >0.5 mag), those belonging to low-luminosity AGB stars; only four stars have a G Ampl >1 mag, which is typical of Miras (Lebzelter et al. 2023).
As described in Chatys et al. (2019) and Kiss et al. (2006), periodic, variable RSGs may present two Per values: a short Per value (fundamental mode), from 200 to 1000 days, and a long secondary period (LSP, Per >1000 days). Only the short Per values can be detectable with Gaia data.
The All-Sky Automated Survey for Supernovae (ASAS-SN) surveyed the entire sky at optical wavelengths down to 17 mag for 4 yr (Jayasinghe et al. 2018), and reported more than 66 000 new variables. When matching the catalog of KM-type stars (Messineo & Brown 2019) with that of ASAS-SN, 194 variables are identified and periods for 43 stars. Only 12 of those are already reported in the Gaia DR3 catalog of variables (mean difference is 83 days with σ = 146 days). The differences between the nine Per values smaller than 700 days have σ = 37 days, as shown in Fig. 6. The three longest Per values have a difference up to 397 days.
In Gaia DR3, there are period determinations for 14 stars from the sample of Chatys et al. (2019), which draw upon data from the American Association of Variable Star Observers (AAVSO)5 covering more than 50 yr. The mean difference between the Gaia DR3 Per values and the fundamental Per values of Chatys et al. (2019) is 54 days and the standard deviation, σ, is 201 days, as plotted in Fig. 6. Typically, the fundamental Per values of RSGs range from 200 to 1500 days.
In conclusion, with the current 2.8-yr baseline, it appears that the Gaia DR3 Per values of bright late-type stars have an accuracy of 200 days. The diagram of KS values versus periods is shown in Fig. 7. Matches to the stars in Messineo & Brown (2019) were searched in the OGLE database6, in the Wide Angle Search for Planets (WASP) time series (Pollacco et al. 2006), and in the Kepler databases (Pollacco et al. 2006; Jenkins et al. 2010) without success7.
5 Identification of C-rich, O-rich, and S-type stars
The sample of Messineo & Brown (2019) is made of a collection of stars taken from the literature and spectroscopically identified as K- and M-type stars of class I, therefore, with O-rich chemistry. Besides a few possible errors, the stars in Messineo & Brown (2019) are O-rich by nature.
C-rich stars are identified by the Gaia DR3 LPV pipeline based on specific spectral features attributed to CN, CO2, C2, TiO, and VO molecular bands (astrophysical_parameter.spectraltype_esphs; Lebzelter et al. 2023). The method is based on the fixed distance of specific peaks. The DR3 flag for C-rich stars given by the Gaia DR3 LPV pipeline erroneously marks several known RSGs (see Table 1) and their BP/RP spectra are shown in Appendix A.
Following the appendix of De Angeli et al. (2023), the BP/RP spectra of bright K-M stars from Messineo & Brown (2019) were retrieved and the GaiaXPy code was run to extract a wavelength function. For comparison, a library of known C-rich stars and S-type stars was compiled and their BP/RP spectra were similarly extracted (e.g., Keenan & Boeshaar 1980; Ake 1979; Stephenson 1976).
The spectra of M-type AGBs and RSGs are dominated by absorption due to the TiO bands. The BP/RP spectra of 11 late S-type stars (e.g., S4/5 and S8/5) present three distinct absorptions, at an average wavelength of 652.9 nm with a standard deviation σ = 1 .6 nm, at 790.7 nm with σ = 4.4nm, and 939.3 nm with σ = 2.1 nm. The strong feature centered at ≈940 nm is due to ZrO bands (e.g., Wing 1972; Rayner et al. 2009; Messineo et al. 2021). The spectral regions around 740 and 790 nm is characterized by two LaO absorption bands (Keenan 1950; MacConnell et al. 2000)8. LaO molecular bands appear in the S4 type, and are strong in the S5 type and later types (Keenan & Boeshaar 1980). The absorption around 653 nm is weak and is due to two ZrO molecular bands from 647.4–647.9 nm to 650.8–651.2nm (e.g., Lloyd Evans & Catchpole 1989; Chen et al. 2022). The BP/RP spectra of eight C-rich present three featuring minima at 704.8 nm with σ = 1.0 nm, at 803.3 nm with σ = 1.5 nm, and at 932.8 nm with σ = 1.5 nm, which are due to three strong CN molecular bands (e.g., Kraemer et al. 2005).
The visual inspection of the BP/RP spectra of stars from Messineo & Brown (2019) confirms that there are no C-rich stars nor S-type stars of class 4 or later (SX/4) among them. Therefore, the stars listed in Table 1 and flagged as C-rich stars by the Gaia DR3 LPV pipeline, are actually false C-rich; indeed, they appear to be KM-types.
Furthermore, an empirical library of BP/RP spectra of known K- and M-type RSGs (Messineo & Brown 2019) and metal-rich O-rich AGB stars (from the sample described in Sect. 6) was built with a few BP/RP spectra, as shown in Appendix A. The spectra were dereddened using the infrared extinction values  determined from the 2MASS JHK measurements, and the extinction curve of Cardelli et al. (1989) extrapolated to the near-infrared with a power law with an index of −1.9 (Messineo et al. 2005). The spectra were normalized to the mean flux. By cross-matching the dereddened BP/RP spectra with the built library of BP/RP spectra, a best matching reference spectrum was selected for each bright star in areas A and B of Messineo & Brown (2019). The minimization was done with the summation of the differences between the two dereddened flux density vectors. The re-assigned spectral types are within about two spectral types from those collected from the literature – more precisely, ±1 spectral type for K-type stars, ±2.5 spectral types for M0–M1 stars, ±1 spectral type for M2–M3 stars, and ±2 spectral type for M4–M5 stars.
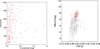 |
Fig. 5 Parameters from the LPV pipeline for the bright late-type stars of Messineo & Brown (2019). Left panel: Per values versus Ampl values of the Gaia variables. The dotted line is drawn by eye to separate the outliers (dark green) from the bulk of the distribution (red). Right panel: bolometric magnitudes versus Teff values of late-type stars from Messineo & Brown (2019) are marked with gray circles. Red and dark green symbols are those with measured Gaia Per values, as in the left panel. |
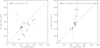 |
Fig. 6 Comparisons of period measurements from Gaia DR3, AAVSO, and ASAS-SN. Left panel: fundamental-mode Per values of RSGs from Chatys et al. (2019) versus the Gaia DR3 Per values. Right panel: Gaia DR3 Per values of 12 late-type stars from Messineo & Brown (2019) versus Per values from the ASAS-SN survey. Chatys et al. (2019) do not include errors. The ASAS II/366/catalog in Vizier does not contain errors. The Gaia DR3 LPV pipeline table includes only frequency and errors on the frequency. |


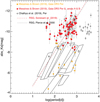 |
Fig. 7 MK magnitudes versus Gaia DR3 Per values of late-type stars in the catalog of Messineo & Brown (2019) (red circles). RSGs with periods from Chatys et al. (2019) are displayed with open diamonds. For comparison, the sequences of variable giants (A, B, C, C′, D) from Riebel et al. (2010) are also shown (black boxes). |
Stars among the ≈1500 O-rich stars in the catalog of Messineo & Brown (2019) that are flagged as C-rich by the LPV pipeline.
6 New highly probable RSGs with Apsis parameters and BP/RP spectra
The entire Gaia DR3 catalog is searched to extract stars with Apsis parameters similar to those of bright stars populating areas A and B of Messineo & Brown (2019).
By selecting with the GSP-Phot parameters stars with −0.7 < log(g) < 0.7 dex, −0.5 < [Fe/H] < 0.5 dex, 2500 < Teff < 3900 K (M-type),  mag (as RSGs in Messineo’s catalog), and also imposing that there are 2MASS and WISE matches, one counts 19499 stars. Only M-type stars are considered, because for those the GSP-Phot Teff values appear reliable.
When counting the Gaia GSP-Spec entries with −0.7 < log(g) < 0.7 dex, −0.5 < [M/H] < 0.5 dex, and 2500 < Teff < 4500 K (K- and M-types),  mag, and also imposing that there are 2MASS and WISE matches, there are 22 470 stars counted. The retrieved entries have the first nine digits of the GSP-Spec quality flag smaller than unity or equal to it, while the 10, 11, and 12 digits were required to be null (Recio-Blanco et al. 2023).
2MASS JHK photometric measurements were retrieved. For each source, by assuming that they are candidate RSGs, a total extinction  was estimated with the JHK magnitudes, the intrinsic colors for K- and M-type supergiants of Koornneef (1983), and the selective extinction ratios of Messineo et al. (2005), as described in Messineo & Brown (2019). Absolute KS (MK) were estimated using the distances from Bailer-Jones et al. (2021), and estimates of their bolometric magnitudes were obtained using the
  of Levesque et al. (2005).
Among the 19499 stars from the GSP-Phot selection, 160 stars are found to belong to class A or B and to have G Ampl < 0. 5 mag (when determined from the LPV pipeline), and these are also not included in the catalog of Messineo & Brown (2019). Similarly, 50 stars were found among the 22470 stars from the GSP-Spec selection, with seven stars already included in the GSP-Phot selection. In conclusion, by using the Apsis parameters and 2MASS photometry 203 (160+50-7) new candidate RSGs from class A or B are identified. The sample has been selected based on their Apsis parameters and may contain O-rich, C-rich, and S-type AGBs and RSGs. By contrast, the catalog of Messineo & Brown (2019), by design, is made up of O-rich AGBs and RSGs (with chemistry known from literature). When searching for stars from Messineo & Brown (2019) which are included in the 19 499 GSP-Phot selected stars, 23 stars is retrieved. In the next sections, this number (203) will be further reduced to a dozen highly-probable RSGs by considering other constraints from the BP/RP spectra, intrinsic photometric colors, and luminosity.
C-rich and S-type stars found among the 203 selected Apsis bright late-type stars.
6.1 Mid-infrared counterparts of the candidates
For the sample of 203 near-IR bright luminous late-type stars, mid-infrared measurements were retrieved from the MSX, WISE, GLIMPSE, and MIPSGAL surveys. There were MSX matches available for 146 sources, WISE matches available for all 203 sources, GLIMPSE matches for 37 sources, and MIPSGAL matches for 27 sources.
6.2 Spectroscopic identification of S- and C-rich stars
When searching with the SIMBAD astronomical database, 10 of the new 203 Apsis selected bright stars are reported as C-rich stars, 15 as S-stars, and 1 as a S/C star (see Table 2). The BP/RP spectra show clear signatures of late S-types for 11 stars, as displayed in Appendix A. For example, star 2162991061217892736 is marked as an S in the SIMBAD astronomical database, but its spectrum is matched with an M2 star because it is most likely to be an early-S star, SX/(1–2). All but one known C-rich stars have been flagged by the Gaia DR3 LPV pipeline and confirmed with a visual inspection of their BP/RP spectra. Cya86 (2MASS J20220156+3634558, Gaia DR3 2057504976503308928) was listed as a C-rich star by Aaronson et al. (1990), however, the Gaia data do not support such a designation, as its spectrum more so resembles that of a K-type star (see Table 2 and Appendix A).
6.3 Photometric identification of S-type, C-rich, and O-rich stars
There are several photometric diagnostics available in the literature to select C-rich stars and S-type stars. For example, C-rich stars can be identified by their near- and mid-infrared colors (e.g., [W3–W4] versus [KS–W3] and [A–D] versus [KS–A]), as described in Messineo et al. ( 018) and Ortiz et al. ( 005). Recently, Abia et al. (2022) analyzed the Gaia photometry and MASS data of evolved bright late-type stars and found that using the extinction-free color,  9, and the luminosity, it is possible to identify C-rich stars (redder), mass-losing AGB stars (bluer), and RSGs. For the newly selected Apsis bright late-type stars, the MK magnitudes are plotted versus the
  colors in Fig. 8. The few known C-rich and S-type stars are marked. For comparison, the brightest K-M-type stars of the Messineo & Brown ( 019) catalog (areas A and B) are also shown. In the MK versus
  diagram, the class I K- M-type stars appear located in a vertical sequence with a narrow color range (0.0–1.0 mag), which extends to MK=−12 mag, as predicted by Abia et al. (2022). In the diagram
  versus WISE [W3–W4] color, two sequences are also visible. One sequence is traced by the class I KM-type stars (areas A and B) of Messineo & Brown (2019), and the other by late-type O-rich and S-type AGB stars. The sequences appear merged at
  mag and [W3–W4] = 0.2–0.4 mag, but they split into two separated sequences for redder [W3–W4]. The two sequences have different
  colors, but similar ranges of the [W3–W4] color. This suggests differences in the surface Teff values/spectral types. Indeed, a correlation appears between the
  colors and the spectral types, as shown in Fig. 9. Spectral types were derived by cross-matching the BP/RP spectra with those of known RSGs (Messineo & Brown 2019) and known late-type AGB stars present in the sample (as described in Sect. 5). The vertical sequence of class I stars is made up of stars earlier than M5, while most of the low-luminosity AGBs have spectral type from M5 to M9. Note that the [W3–W4] colors have not been dereddened; at these wavelengths, the obscuration is negligible with respect to the range of [W3–W4] colors spanned by the stars. The
  values of stars in areas A and B of Messineo & Brown (2019) range from 0 to 0.7 mag, and, therefore, A(W3) is below 0.38 and A(W4) is below 0.28 mag (Messineo et al. 2005). This implies that the reddening E(W3–W4) is below 0.1 mag. The [W3–W4] color is likely indicating a different types of envelopes (mass loss), as seen for the KS–W4 (e.g., Messineo et al. 2017).
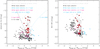 |
Fig. 8 Photometric diagrams to distinguish AGBs and RSGs. Left pαnel: MK values versus |


 |
Fig. 9 Spectral types inferred from the BP/RP spectra versus the |


Twenty new Galactic RSGs.
6.4 A sample of very likely RSGs
From a sample of about 40000 stars with Apsis parameters compatible with those of RSGs, 203 bright stars are found to populate areas A and B of the luminosity versus Teff diagram of Messineo & Brown (2019). When removing the C-rich stars and S-type stars and retaining the stars brighter than Mk = −8.5 mag and bluer than the dashed line  (drawn in Fig. 8), only 20 RSGs remain (out of 203 bright stars populating areas A and B), listed in Table 3. The cut removes the strong contamination of O-rich AGBs.
When applying the same cut to the class I K-M stars from areas A and B of Messineo & Brown (2019), a sample of 312 RSGs out of 486 stars is obtained – or, otherwise, 87 RSGs out of 133 stars when considering those with available Gaia spectra. Therefore, the new 20 RSGs represent an increase of 23% of the currently known Gaia RSGs with Gaia spectra.
Six newly selected stars have estimated values of Mbol < −7.1 mag. 2MASS J21015501+4517205 is on the Perseus arm at (1, b) = (86.59°, −0.77°). This source was not detected in a search for a 43 GHz SiO maser (Deguchi et al. 2005). In the present work, an M3 type is inferred.
2MASS J16291280-4956384 and 2MASS J17084131-4026595 seem to belong to the Scutum-Crux arm with (1, b) = (−13.77°, −0.13°) and (1, b) = (−25.49°, −0.91°), respectively. 2MASS J16291280−4956384 coincides with IRAS 16254−4950 (M3–5) which has a strong 10 µm silicate feature in emission (Volk & Cohen 1989). 2MASS J17084131−4026595 coincides with IRAS 17051−4023. In the IRAS LRS catalog, its spectrum is characterized by a strong silicate feature in emission (Volk & Cohen 1989) and with the BP/RP spectrum an M3.5 I type is derived.
2MASS J10192621−5818105 is located on the Sagittarius-Carina arm at (1, b)=(−75.95°, −1.11°) and coincides with IRAS 10176-5802. An SiO maser emission was detected at 86 GHz with a central velocity of VLSR = −10.0 km−1 by Haikala et al. (1994). The source has an IRAS low-resolution spectrum that displays the 10 µm silicate feature in emission (Olnon et al. 1986), which indicates an oxygen-rich envelope that is optically thin. Skiff (2014) reports an M4/S? type, while in this work, the luminosity and BP/RP spectrum are suggestive of an M2 I.
2MASS J20230860+3651450 is on the local arm at (1, b) = (75.47°, −0.21°) and coincides with IRC +40413, which is classified as an M5 supergiant by Grasdalen & Sneden (1979). The supergiant class is not, however, annotated in the SIMBAD database and Skiff (2014) reports M1/M4/M5 types for it. Its BP/RP spectrum fits better that of an M3 I star.
2MASS J20230860+3651450 coincides with IRAS 16454−4212 and it is most likely an M2 type. There is no other information on the SIMBAD database about this star.
In Fig. 10, the luminosities of the newly detected 20 RSGs are plotted against their Teff values. The stellar tracks of rotating stars with solar metallicity and masses from 9 to 25 M⊙ successfully enclose the range of luminosities of the new RSGs (Ekström et al. 2012). In Fig. 11, the MK magnitudes of the variables are plotted versus their Gaia DR3 Per values. The two brightest stars (2MASS J21015501+4517205 and 2MASS J10192621−5818105) of the sample are located on the period-luminosity sequence of RSGs and have luminosity above that of the AGB limit (Mbol = −8.4 and −7.9 mag, respectively).
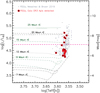 |
Fig. 10 Luminosities versus Teff values of the 20 new very probable RSGs (filled-black circles, encircled by red rings) which were found by analyzing stars with Apsis parameters. For comparison, the highly-probable RSGs among the class I stars listed by Messineo & Brown (2019) are also plotted with gray-filled circles. Tracks of rotating stars at solar metallicity from Ekström et al. (2012) are over-plotted; the black dotted–dashed curve marks a 7 M⊙ track; the green long-dashed curve marks a 9 M⊙ track; the black-dotted curve marks a 12 M⊙ track; the green dotted-dashed curve shows a 15 M⊙ track; the black long-dashed curve marks a 20 M⊙ track; the top green-dotted line shows a 25 M⊙ track. The horizontal magenta-dashed line indicates the AGB magnitude limit. |
7 Conclusive summary
In this work, we analyze existing Apsis GSP-Phot and GSP-Spec parameters of known RSG stars and bright AGB stars from the catalog of Messineo & Brown (2019). Only nine known RSGs have GSP-Spec parameters available from DR3, while 79 RSGs have GSP-Phot parameters. The BP/RP spectra of class I stars in Messineo & Brown (2019) confirm that the sample is made up of O-rich stars.
The Apsis parameters from the GSP-Phot and GSP-Spec pipelines have been compared with parameters from the literature, keeping in mind that the synthetic models used to fit the BR/RP spectra are not suitable for mass-losing stars and do not include the peculiar chemistry of the AGB envelopes. Several biases have been demonstrated.
The GSP-Phot module analyzes the stellar energy distribution (SED) of the stars and absolute fluxes; it suffers from degeneracy between temperature and interstellar extinction (a higher estimated extinction mimics a higher Teff) and is advised only for stars located at moderate extinction (AV <2 mag, Andrae et al. 2023).
The GSP-Spec module is independent of distances and extinction, based only on the analysis of normalized spectra.
However, it fails to measure supersolar metallicity in RSGs. There are only a few gravity values of good quality, and it is advisable to recalculate them from the stellar luminosity. The stellar Teff values estimated by Messineo & Brown (2019) agree with those released by the GSP-module within 300 K, well within the selected quality flag (ΔTeff = 500 K).
The Gaia DR3 database was searched for Apsis GSP-Phot and GSP-Spec parameters similar to those of known RSGs. The initial 44 000 entries were reduced to 203 entries after having estimated the infrared luminosities – and to 20 entries when cutting the catalog at MK = −8.5 mag and removing the bluest sources in the  colors, which are very likely to be AGBs (Abia et al. 2022). The BP/RP spectra of the new 20 RSGs display features of M1–M3.5 stars, plus one K3.
We note that we did find some C-rich stars and S-type stars were contaminating the built sample. These were identified in the SIMBAD database and confirmed with the MK versus  diagram of Abia et al. (2022), as well as with a direct inspection of the morphology of their BP/RP spectra. Indeed, their BP/RP spectra show absorption features due to ZrO and LaO molecules, with the most prominent one centered at 940 nm.
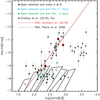 |
Fig. 11 MK magnitudes versus periods of the variables in the newly selected Apsis sample (black-filled circles). Encircled in red are the very-probable RSGs, and in green are the targets reported as C-rich or S-type stars in the SIMBAD database. For comparison, diamonds mark the location of well-known RSGs (Chatys et al. 2019; Messineo et al. 2021). The red long-dashed line is the period-luminosity relation from Soraisam et al. (2018) and the dotted line is that of Pierce et al. (2000). The boxes indicate the loci of the giant sequences as described in Riebel et al. (2010). |
Acknowledgements
This work has made use of data from the European Space Agency (ESA) mission Gaia (http://www.cosmos.esa.int/gaia), processed by the Gaia Data Processing and Analysis Consortium (DPAC, http://www.cosmos.esa.int/web/gaia/dpac/consortium). Funding for the DPAC has been provided by national institutions, in particular the institutions participating in the Gaia Multilateral Agreement. This publication makes use of data products from the Two Micron All Sky Survey, which is a joint project of the University of Massachusetts and the Infrared Processing and Analysis Center/California Institute of Technology, funded by the National Aeronautics and Space Administration and the National Science Foundation. This work is based on observations made with the Spitzer Space Telescope, which is operated by the Jet Propulsion Laboratory, California Institute of Technology under a contract with NASA. This research made use of data products from the Midcourse Space Experiment, the processing of which was funded by the Ballistic Missile Defense Organization with additional support from the NASA office of Space Science. This publication makes use of data products from WISE, which is a joint project of the University of California, Los Angeles, and the Jet Propulsion Laboratory/California Institute of Technology, funded by the National Aeronautics and Space Administration. This research has made use of the VizieR catalogue access tool, CDS, Strasbourg, France, and SIMBAD database. This research utilized the NASA’s Astrophysics Data System Bibliographic Services. This work uses the RSG catalog by Messineo & Brown (2019) which was supported by the National Natural Science Foundation of China (NSFC-11773025, 11421303), and USTC grant KY2030000054. M.M. thanks Prof. Anthony Brown for helping her to realize the 2019 catalog. M.M. thanks the referee for his careful reading and constructive comments.
Appendix A BP/RP spectra
Figures A.1 and A.2 display the BP/RP spectra of C-rich stars and S-type stars found among the 203 newly selected bright late-type stars (described in Sect. 6).
In Figure A.3, a small compiled library of spectra of known RSGs is displayed, while the bright K-M stars erroneously flagged as C-rich stars by the LPV pipeline are shown in Fig. A.5.
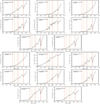 |
Fig. A.1 Gaia BP/RP spectra of S-type stars in the new selected 203 bright late-type stars in Sect. 6. The vertical red long-dashed lines mark the locations of the three broad absorptions seen in S-rich stars. For comparison, the centroids of the absorption seen in C-type (blue) and M1-M3 O-rich stars (orange) are also shown. |
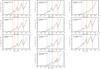 |
Fig. A.2 Gaia BP/RP spectra of known C-rich stars in the new selected 203 bright late-type stars in Sect. 6. The vertical blue dotted lines mark the locations of the main absorption lines seen in C-rich stars. For comparison, the centroids of the absorption seen in S-type (red) and M1-M3 O-rich stars (orange) are also shown. |
 |
Fig. A.3 Gaia BP/RP spectra of well-known RSGs in the catalog of Messineo & Brown (2019). The vertical orange dotted-dashed lines mark the locations of the main absorption bands seen in M1-M3 RSGs and O-rich stars. For comparison, the centroids of the absorption seen in S-type (red) and C-rich stars (blue) are also shown (see also https://mariamessineo.github.io/KMclassI-DR3_AB_BP-RPspectra/). |
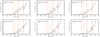 |
Fig. A.4 Gaia BP/RP spectra of known late-M AGB stars found among the 203 new Apsis selected bright late-type stars (see Sect. 6). The vertical orange dotted-dashed lines mark the locations of the main absorption bands seen in M1-M3 RSGs and O-rich stars. For comparison, the centroids of the absorption seen in S-type (red) and in C-rich stars (blue) are also shown. |
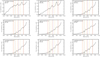 |
Fig. A.5 Gaia BP/RP spectra of stars in the catalog of Messineo & Brown (2019), which are flagged as C-rich by the LPV pipeline. The vertical orange dotted-dashed lines mark the locations of the main absorption bands seen in M1-M3 RSGs and O-rich stars. For comparison, the centroids of the absorption seen in S-type (red) and in C-rich stars (blue) are also shown. |
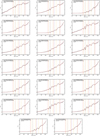 |
Fig. A.6 BP/RP spectra of the newly detected very-likely RSGs, shown with a black curve. The red-dashed curves show the BP/RP spectra of stars from Messineo & Brown (2019) used as references. The reference spectra have been brought to the target extinction using the infrared-derived |

References
- Aaronson, M., Blanco, V. M., Cook, K. H., Olszewski, E. W., & Schechter, P. L. 1990, ApJS, 73, 841 [NASA ADS] [CrossRef] [Google Scholar]
- Abia, C., de Laverny, P., Romero-Gómez, M., & Figueras, F. 2022, A&A, 664, A45 [NASA ADS] [CrossRef] [EDP Sciences] [Google Scholar]
- Ake, T.B. 1979, ApJ, 234, 538 [NASA ADS] [CrossRef] [Google Scholar]
- Andrae, R., Fouesneau, M., Sordo, R., et al. 2023, A&A, in press, https://doi.org/10.1051/0004-6361/202243462 [Google Scholar]
- Bailer-Jones, C. A. L., Rybizki, J., Fouesneau, M., Demleitner, M., & Andrae, R. 2021, AJ, 161, 147 [Google Scholar]
- Cardelli, J. A., Clayton, G. C., & Mathis, J. S. 1989, ApJ, 345, 245 [Google Scholar]
- Chatys, F. W., Bedding, T.R., Murphy, S.J., et al. 2019, MNRAS, 487, 4832 [CrossRef] [Google Scholar]
- Chen, J., Luo, A. L., Li, Y.-B., et al. 2022, ApJ, 931, 133 [NASA ADS] [CrossRef] [Google Scholar]
- Davies, B., Kudritzki, R.-P., & Figer, D. F. 2010, MNRAS, 407, 1203 [NASA ADS] [CrossRef] [Google Scholar]
- De Angeli, F., Weiler, M., Montegriffo, P., et al. 2023, A&A, in press, https://doi.org/10.1051/0004-6361/202243680 [Google Scholar]
- Deguchi, S., Nakashima, J.-I., Miyata, T., & Ita, Y. 2005, PASJ, 57, 933 [CrossRef] [Google Scholar]
- Ekström, S., Georgy, C., Eggenberger, P., et al. 2012, A&A, 537, A146 [Google Scholar]
- Ferraro, F. R., Messineo, M., Fusi Pecci, F., et al. 1999, AJ, 118, 1738 [NASA ADS] [CrossRef] [Google Scholar]
- Fitzpatrick, E. L. 1999, PASP, 111, 63 [Google Scholar]
- Fouesneau, M., Frémat, Y., Andrae, R., et al. 2023, A&A, in press, https:// doi.org/10.1051/0004-6361/202243919 [Google Scholar]
- Gaft, M., Nagli, L., Gornushkin, I., & Raichlin, Y. 2022, Spectrochim. Acta, 192, 106426 [NASA ADS] [CrossRef] [Google Scholar]
- Gazak, J. Z., Davies, B., Kudritzki, R., Bergemann, M., & Plez, B. 2014, ApJ, 788, 58 [NASA ADS] [CrossRef] [Google Scholar]
- Grasdalen, G. L., & Sneden, C. 1979, PASP, 91, 337 [NASA ADS] [CrossRef] [Google Scholar]
- Haikala, L. K., Nyman, L. A., & Forsstroem, V. 1994, A&AS, 103, 107 [NASA ADS] [Google Scholar]
- Houk, N., & Swift, C. 1999, Michigan Spectral Survey, 5, 0 [Google Scholar]
- Howell, S. B., Sobeck, C., Haas, M., et al. 2014, PASP, 126, 398 [Google Scholar]
- Huber, D., Bryson, S. T., Haas, M. R., et al. 2016, ApJS, 224, 2 [Google Scholar]
- Jayasinghe, T., Kochanek, C. S., Stanek, K. Z., et al. 2018, MNRAS, 477, 3145 [Google Scholar]
- Jenkins, J. M., Caldwell, D. A., Chandrasekaran, H., et al. 2010, ApJ, 713, L87 [Google Scholar]
- Keenan, P. C. 1950, AJ, 55, 74 [NASA ADS] [CrossRef] [Google Scholar]
- Keenan, P. C., & Boeshaar, P. C. 1980, ApJS, 43, 379 [NASA ADS] [CrossRef] [Google Scholar]
- Kervella, P., Arenou, F., & Thévenin, F. 2022, A&A, 657, A7 [NASA ADS] [CrossRef] [EDP Sciences] [Google Scholar]
- Kiss, L. L., Szabó, G. M., & Bedding, T. R. 2006, MNRAS, 372, 1721 [Google Scholar]
- Koornneef, J. 1983, A&A, 128, 84 [NASA ADS] [Google Scholar]
- Kraemer, K. E., Sloan, G. C., Wood, P. R., Price, S. D., & Egan, M. P. 2005, ApJ, 631, L147 [NASA ADS] [CrossRef] [Google Scholar]
- Lebzelter, T., Mowlavi, N., Lecoeur-Taibi, I., et al. 2023, A&A, in press, https://doi.org/10.1051/0004-6361/202244241 [Google Scholar]
- Levesque, E. M., Massey, P., Olsen, K. A. G., et al. 2005, ApJ, 628, 973 [Google Scholar]
- Lloyd Evans, T., & Catchpole, R. M. 1989, MNRAS, 237, 219 [NASA ADS] [CrossRef] [Google Scholar]
- MacConnell, D. J., Wing, R. F., & Costa, H. E. 2000, PASP, 112, 65 [NASA ADS] [CrossRef] [Google Scholar]
- Maíz Apellániz, J., Pantaleoni González, M., & Barbá, R. H. 2021, A&A, 649, A13 [NASA ADS] [CrossRef] [EDP Sciences] [Google Scholar]
- Messineo, M. 2022, PASJ, 74, 1049 [NASA ADS] [CrossRef] [Google Scholar]
- Messineo, M., & Brown, A. G. A. 2019, AJ, 158, 20 [NASA ADS] [CrossRef] [Google Scholar]
- Messineo, M., Habing, H. J., Menten, K. M., et al. 2005, A&A, 435, 575 [NASA ADS] [CrossRef] [EDP Sciences] [Google Scholar]
- Messineo, M., Zhu, Q., Menten, K. M., et al. 2017, ApJ, 836, 65 [NASA ADS] [CrossRef] [Google Scholar]
- Messineo, M., Habing, H. J., Sjouwerman, L. O., Omont, A., & Menten, K. M. 2018, A&A, 619, A35 [NASA ADS] [CrossRef] [EDP Sciences] [Google Scholar]
- Messineo, M., Figer, D. F., Kudritzki, R.-P., et al. 2021, AJ, 162, 187 [NASA ADS] [CrossRef] [Google Scholar]
- Olnon, F. M., Raimond, E., Neugebauer, G., et al. 1986, A&AS, 65, 607 [NASA ADS] [Google Scholar]
- Ortiz, R., Lorenz-Martins, S., Maciel, W. J., & Rangel, E. M. 2005, A&A, 431, 565 [NASA ADS] [CrossRef] [EDP Sciences] [Google Scholar]
- Pierce, M. J., Jurcevic, J. S., & Crabtree, D. 2000, MNRAS, 313, 271 [NASA ADS] [CrossRef] [Google Scholar]
- Pollacco, D. L., Skillen, I., Collier Cameron, A., et al. 2006, PASP, 118, 1407 [NASA ADS] [CrossRef] [Google Scholar]
- Popper, D. M. 1948, PASP, 60, 248 [NASA ADS] [CrossRef] [Google Scholar]
- Rayner, J. T., Cushing, M. C., & Vacca, W. D. 2009, ApJS, 185, 289 [Google Scholar]
- Recio-Blanco, A., de Laverny, P., Palicio, P. A., et al. 2023, A&A, in press, https://doi.org/10.1051/0004-6361/202243750 [Google Scholar]
- Riebel, D., Meixner, M., Fraser, O., et al. 2010, ApJ, 723, 1195 [NASA ADS] [CrossRef] [Google Scholar]
- Skiff, B. A. 2014, VizieR Online Data Catalog: B/mk [Google Scholar]
- Soraisam, M. D., Bildsten, L., Drout, M. R., et al. 2018, ApJ, 859, 73 [NASA ADS] [CrossRef] [Google Scholar]
- Soszyński, I., Udalski, A., Szymański, M. K., et al. 2013, Acta Astron., 63, 21 [NASA ADS] [Google Scholar]
- Stephenson, C. B. 1976, Publications of the Warner & Swasey Observatory, 2, 2 [NASA ADS] [Google Scholar]
- Szymanski, M., Udalski, A., Kubiak, M., et al. 1996, Acta Astron., 46, 1 [NASA ADS] [Google Scholar]
- Volk, K., & Cohen, M. 1989, AJ, 98, 931 [NASA ADS] [CrossRef] [Google Scholar]
- Wing, R. F. 1972, in Les Spectres des Astres dans l’Infrarouge et les Microondes, 123 [Google Scholar]
Using the compilation of Skiff (2014) and Messineo & Brown (2019), 203 RSGs mentioned in literature as possible members of stellar clusters and associations (independently of parallaxes) were counted, 32 obscured RSGs in the proximity of the Galactic center, and other 394 isolated stars with good Gaia DR3 parallaxes and luminosity in areas A and B.
M. Messineo and A. G. A. Brown 2021, Zenodo technical note https://doi.org/18.5281/zenodo.4964818
A=Stars with Mbol above the AGB limit (Mbol≳ −7.1 mag); B = Stars with −5 < Mbol <−7.1 mag earlier than M4 (Teff ≳ 3548 K); C = Stars with −5 < Mbol <−7.1 mag later than an M4 (Teff ≲ 3548 K); D = Stars with −3.6 < Mbol <−5 mag along the observed distribution of massive giants and E = Stars with −3.6 < Mbol < − 5 mag redder than that; F = Stars with Mbol > −3.6 mag.
Vizier catalog I/244A, Optical Gravitational Lensing Experiment (OGLE) General Catalog of Stars. I. by Szymanski et al. (1996) and catalog J/AcA/63/21, VI light curves of Galactic LPVs by Soszynski et al. (2013).
The NASA Exoplanet Archive is available at https://exoplanetarchive.ipac.caltech.edu/ The K2 input catalog includes the 2MASS J06090134+2352227 and 2MASS J17462538-2612011 sources (e.g., Huber et al. 2016; Howell et al. 2014), with an observed light curve for the latter target. 2MASS J17462538-2612011 (Mbol = −5.280mag, RUWE=1.7) is reported as an eclipsing binary (K5Ib+A) with Per >35 days and composite spectrum at the maximum light by Popper (1948); indeed, it shows an anomaly in its motion (Kervella et al. 2022). However, it does not have a Gaia BP/RP spectrum or RVS spectrum, and it is neither flagged as a Gaia variable.
Recently, the two LaO band-heads at 740.6 and 791.4 nm were measured in the laboratory by Gaft et al. (2022).
 , as defined in Abia et al. (2022).
All Tables
Stars among the ≈1500 O-rich stars in the catalog of Messineo & Brown (2019) that are flagged as C-rich by the LPV pipeline.
C-rich and S-type stars found among the 203 selected Apsis bright late-type stars.
All Figures
|
Fig. 1 Gaia GSP-Phot Teff and A0 (0.55 nm) extinction values of stars in Messineo & Brown (2019, areas A and B). Leftpαnel: Teff values adopted from literature by Messineo & Brown (2019) versus the Teff from the Gaia DR3 BP/RP spectra. Data points in red indicate log(g) < 0.5. Right panel: Gaia GSP-Phot A0 values versus the A0 values |
| In the text | |
|
Fig. 2 log(g) values given by Gaia DR3 pipeline compared with those estimated from the stellar luminosities, for stars in Messineo & Brown (2019, areas A and B). Left panel: log(g) from the luminosity relation derived by Messineo et al. (2021) versus GSP-Phot log(g). Right panel: log(g) from the luminosity relation versus Gaia GSP-Spec log(g). Only data points with good distance and from areas A and B of Messineo & Brown (2019) are plotted. The dashed line is the equity line, while the dashed-dotted line has been shifted by −0.8 dex. |
| In the text | |
|
Fig. 3 [Fe/H] values from spectroscopic published works versus the [Fe/H] values inferred by the GSP-Phot and GSP-Spec module. The red filled circles are data points located in the areas A and B of the Luminosity–Teff diagram of Messineo & Brown (2019). Encircled data points are from the works of Davies et al. (2010) and Gazak et al. (2014). Left panel: [Fe/H] values from the literature versus those inferred from GSP-Phot module. Middle panel: [Fe/H] values from the literature versus the [M/H] values inferred from GSP-Spec. Right panel: [Fe/H] values from the literature versus the [Fe/H] values inferred from GSP-Spec [M/H] and GSP-Spec [α/Fe] using the formula of Ferraro et al. (1999). |
| In the text | |
|
Fig. 4 Teff values from Messineo & Brown (2019) versus the Teff values inferred from the GSP-Spec module. Only stars with luminosity above the tip of the red giant branch and with |
| In the text | |
|
Fig. 5 Parameters from the LPV pipeline for the bright late-type stars of Messineo & Brown (2019). Left panel: Per values versus Ampl values of the Gaia variables. The dotted line is drawn by eye to separate the outliers (dark green) from the bulk of the distribution (red). Right panel: bolometric magnitudes versus Teff values of late-type stars from Messineo & Brown (2019) are marked with gray circles. Red and dark green symbols are those with measured Gaia Per values, as in the left panel. |
| In the text | |
|
Fig. 6 Comparisons of period measurements from Gaia DR3, AAVSO, and ASAS-SN. Left panel: fundamental-mode Per values of RSGs from Chatys et al. (2019) versus the Gaia DR3 Per values. Right panel: Gaia DR3 Per values of 12 late-type stars from Messineo & Brown (2019) versus Per values from the ASAS-SN survey. Chatys et al. (2019) do not include errors. The ASAS II/366/catalog in Vizier does not contain errors. The Gaia DR3 LPV pipeline table includes only frequency and errors on the frequency. |
| In the text | |
|
Fig. 7 MK magnitudes versus Gaia DR3 Per values of late-type stars in the catalog of Messineo & Brown (2019) (red circles). RSGs with periods from Chatys et al. (2019) are displayed with open diamonds. For comparison, the sequences of variable giants (A, B, C, C′, D) from Riebel et al. (2010) are also shown (black boxes). |
| In the text | |
|
Fig. 8 Photometric diagrams to distinguish AGBs and RSGs. Left pαnel: MK values versus |
| In the text | |
|
Fig. 9 Spectral types inferred from the BP/RP spectra versus the |
| In the text | |
|
Fig. 10 Luminosities versus Teff values of the 20 new very probable RSGs (filled-black circles, encircled by red rings) which were found by analyzing stars with Apsis parameters. For comparison, the highly-probable RSGs among the class I stars listed by Messineo & Brown (2019) are also plotted with gray-filled circles. Tracks of rotating stars at solar metallicity from Ekström et al. (2012) are over-plotted; the black dotted–dashed curve marks a 7 M⊙ track; the green long-dashed curve marks a 9 M⊙ track; the black-dotted curve marks a 12 M⊙ track; the green dotted-dashed curve shows a 15 M⊙ track; the black long-dashed curve marks a 20 M⊙ track; the top green-dotted line shows a 25 M⊙ track. The horizontal magenta-dashed line indicates the AGB magnitude limit. |
| In the text | |
|
Fig. 11 MK magnitudes versus periods of the variables in the newly selected Apsis sample (black-filled circles). Encircled in red are the very-probable RSGs, and in green are the targets reported as C-rich or S-type stars in the SIMBAD database. For comparison, diamonds mark the location of well-known RSGs (Chatys et al. 2019; Messineo et al. 2021). The red long-dashed line is the period-luminosity relation from Soraisam et al. (2018) and the dotted line is that of Pierce et al. (2000). The boxes indicate the loci of the giant sequences as described in Riebel et al. (2010). |
| In the text | |
|
Fig. A.1 Gaia BP/RP spectra of S-type stars in the new selected 203 bright late-type stars in Sect. 6. The vertical red long-dashed lines mark the locations of the three broad absorptions seen in S-rich stars. For comparison, the centroids of the absorption seen in C-type (blue) and M1-M3 O-rich stars (orange) are also shown. |
| In the text | |
|
Fig. A.2 Gaia BP/RP spectra of known C-rich stars in the new selected 203 bright late-type stars in Sect. 6. The vertical blue dotted lines mark the locations of the main absorption lines seen in C-rich stars. For comparison, the centroids of the absorption seen in S-type (red) and M1-M3 O-rich stars (orange) are also shown. |
| In the text | |
|
Fig. A.3 Gaia BP/RP spectra of well-known RSGs in the catalog of Messineo & Brown (2019). The vertical orange dotted-dashed lines mark the locations of the main absorption bands seen in M1-M3 RSGs and O-rich stars. For comparison, the centroids of the absorption seen in S-type (red) and C-rich stars (blue) are also shown (see also https://mariamessineo.github.io/KMclassI-DR3_AB_BP-RPspectra/). |
| In the text | |
|
Fig. A.4 Gaia BP/RP spectra of known late-M AGB stars found among the 203 new Apsis selected bright late-type stars (see Sect. 6). The vertical orange dotted-dashed lines mark the locations of the main absorption bands seen in M1-M3 RSGs and O-rich stars. For comparison, the centroids of the absorption seen in S-type (red) and in C-rich stars (blue) are also shown. |
| In the text | |
|
Fig. A.5 Gaia BP/RP spectra of stars in the catalog of Messineo & Brown (2019), which are flagged as C-rich by the LPV pipeline. The vertical orange dotted-dashed lines mark the locations of the main absorption bands seen in M1-M3 RSGs and O-rich stars. For comparison, the centroids of the absorption seen in S-type (red) and in C-rich stars (blue) are also shown. |
| In the text | |
|
Fig. A.6 BP/RP spectra of the newly detected very-likely RSGs, shown with a black curve. The red-dashed curves show the BP/RP spectra of stars from Messineo & Brown (2019) used as references. The reference spectra have been brought to the target extinction using the infrared-derived |
| In the text | |
Current usage metrics show cumulative count of Article Views (full-text article views including HTML views, PDF and ePub downloads, according to the available data) and Abstracts Views on Vision4Press platform.
Data correspond to usage on the plateform after 2015. The current usage metrics is available 48-96 hours after online publication and is updated daily on week days.
Initial download of the metrics may take a while.