Fig. 5
Download original image
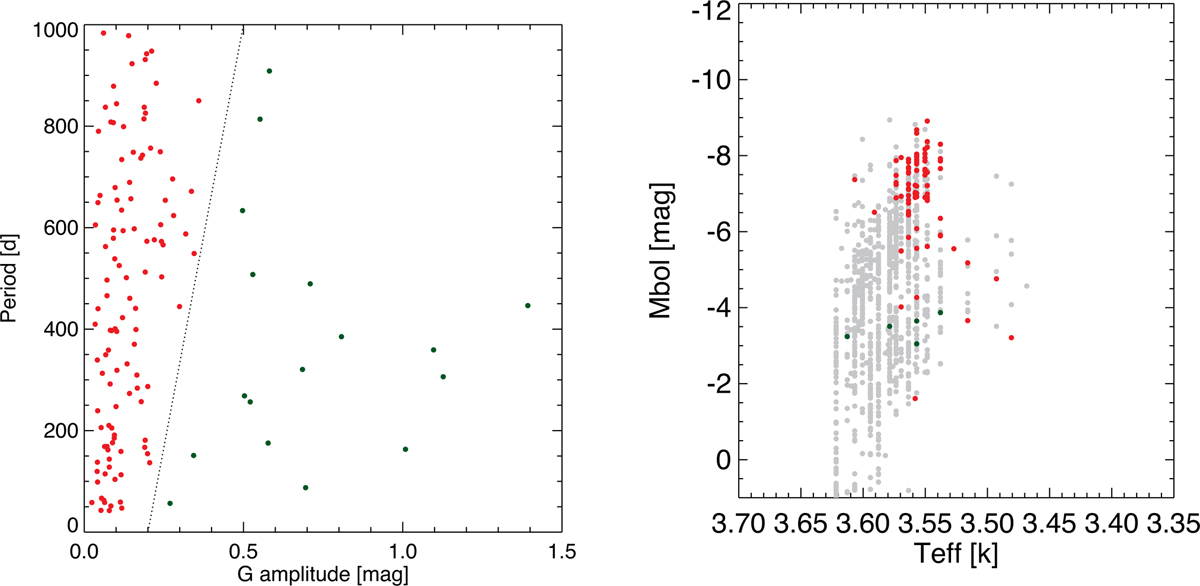
Parameters from the LPV pipeline for the bright late-type stars of Messineo & Brown (2019). Left panel: Per values versus Ampl values of the Gaia variables. The dotted line is drawn by eye to separate the outliers (dark green) from the bulk of the distribution (red). Right panel: bolometric magnitudes versus Teff values of late-type stars from Messineo & Brown (2019) are marked with gray circles. Red and dark green symbols are those with measured Gaia Per values, as in the left panel.
Current usage metrics show cumulative count of Article Views (full-text article views including HTML views, PDF and ePub downloads, according to the available data) and Abstracts Views on Vision4Press platform.
Data correspond to usage on the plateform after 2015. The current usage metrics is available 48-96 hours after online publication and is updated daily on week days.
Initial download of the metrics may take a while.