Fig. A.5
Download original image
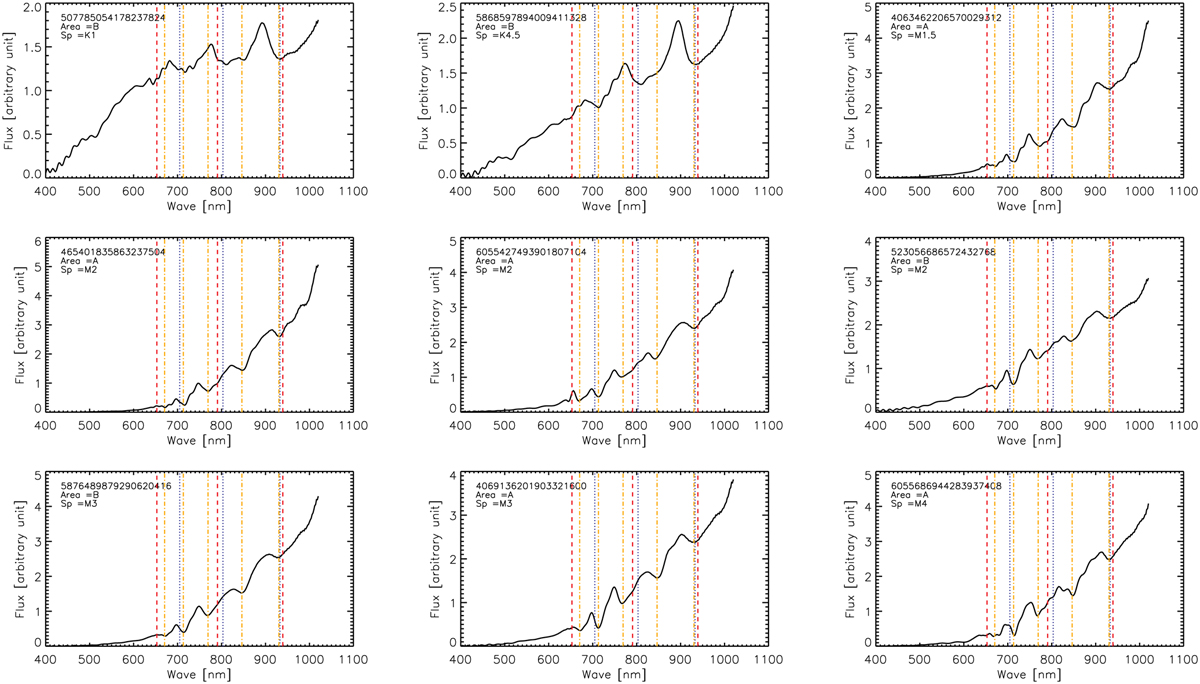
Gaia BP/RP spectra of stars in the catalog of Messineo & Brown (2019), which are flagged as C-rich by the LPV pipeline. The vertical orange dotted-dashed lines mark the locations of the main absorption bands seen in M1-M3 RSGs and O-rich stars. For comparison, the centroids of the absorption seen in S-type (red) and in C-rich stars (blue) are also shown.
Current usage metrics show cumulative count of Article Views (full-text article views including HTML views, PDF and ePub downloads, according to the available data) and Abstracts Views on Vision4Press platform.
Data correspond to usage on the plateform after 2015. The current usage metrics is available 48-96 hours after online publication and is updated daily on week days.
Initial download of the metrics may take a while.