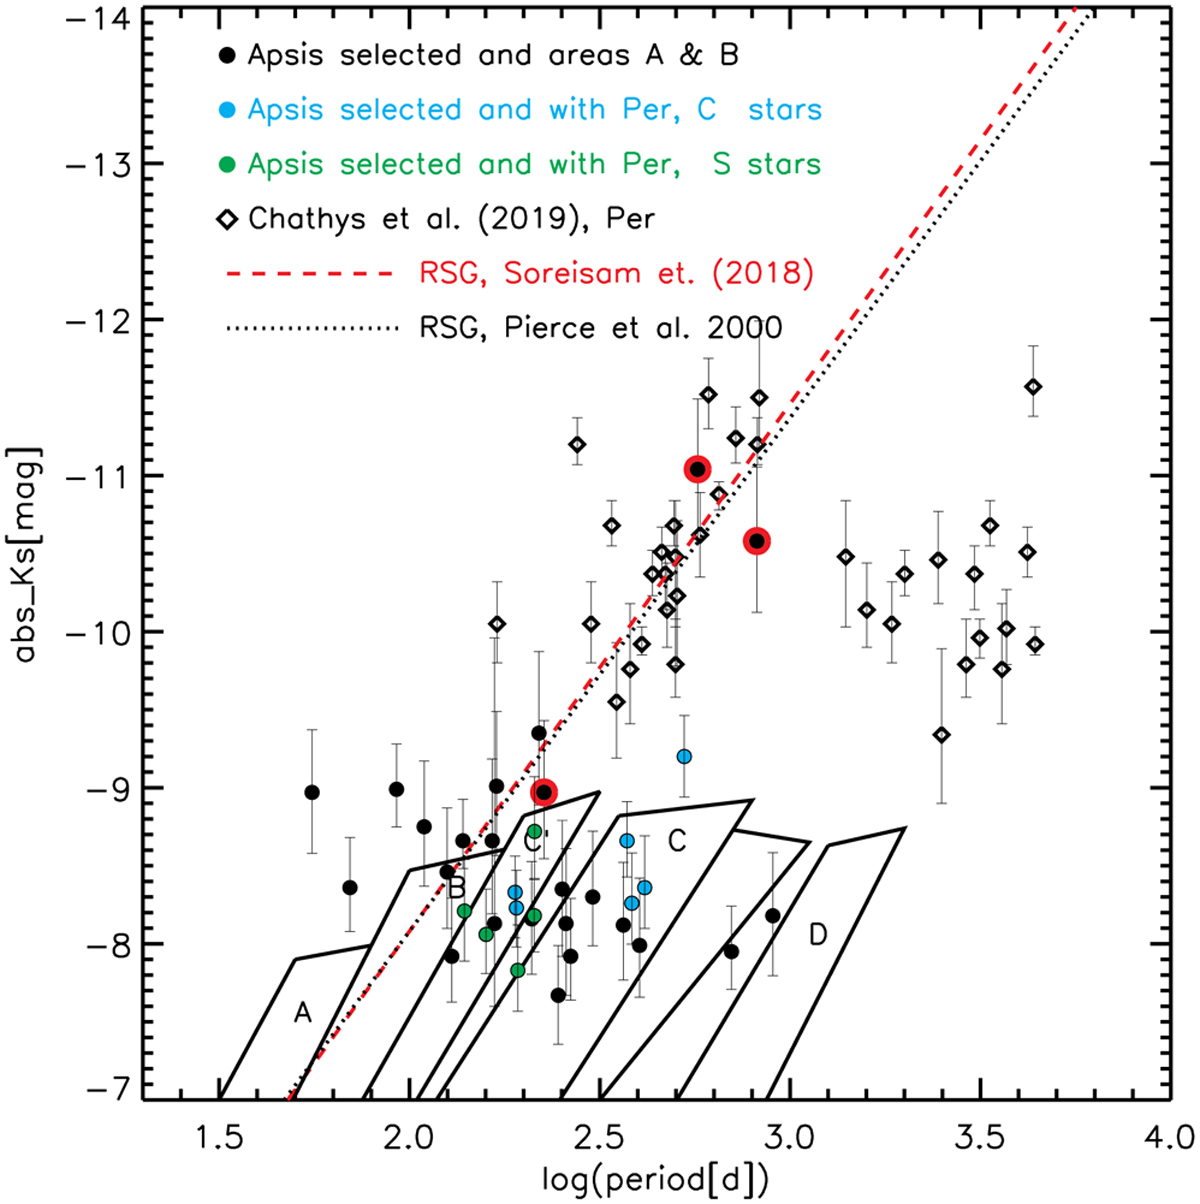
Fig. 11
Download original image
MK magnitudes versus periods of the variables in the newly selected Apsis sample (black-filled circles). Encircled in red are the very-probable RSGs, and in green are the targets reported as C-rich or S-type stars in the SIMBAD database. For comparison, diamonds mark the location of well-known RSGs (Chatys et al. 2019; Messineo et al. 2021). The red long-dashed line is the period-luminosity relation from Soraisam et al. (2018) and the dotted line is that of Pierce et al. (2000). The boxes indicate the loci of the giant sequences as described in Riebel et al. (2010).
Current usage metrics show cumulative count of Article Views (full-text article views including HTML views, PDF and ePub downloads, according to the available data) and Abstracts Views on Vision4Press platform.
Data correspond to usage on the plateform after 2015. The current usage metrics is available 48-96 hours after online publication and is updated daily on week days.
Initial download of the metrics may take a while.