Fig. 2
Download original image
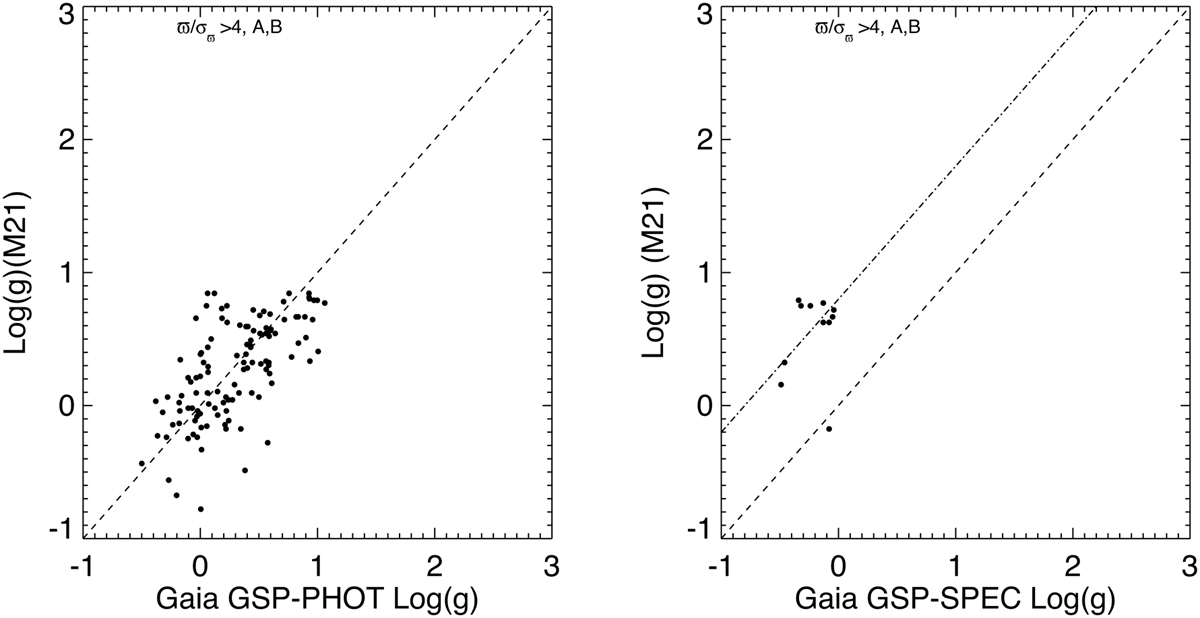
log(g) values given by Gaia DR3 pipeline compared with those estimated from the stellar luminosities, for stars in Messineo & Brown (2019, areas A and B). Left panel: log(g) from the luminosity relation derived by Messineo et al. (2021) versus GSP-Phot log(g). Right panel: log(g) from the luminosity relation versus Gaia GSP-Spec log(g). Only data points with good distance and from areas A and B of Messineo & Brown (2019) are plotted. The dashed line is the equity line, while the dashed-dotted line has been shifted by −0.8 dex.
Current usage metrics show cumulative count of Article Views (full-text article views including HTML views, PDF and ePub downloads, according to the available data) and Abstracts Views on Vision4Press platform.
Data correspond to usage on the plateform after 2015. The current usage metrics is available 48-96 hours after online publication and is updated daily on week days.
Initial download of the metrics may take a while.