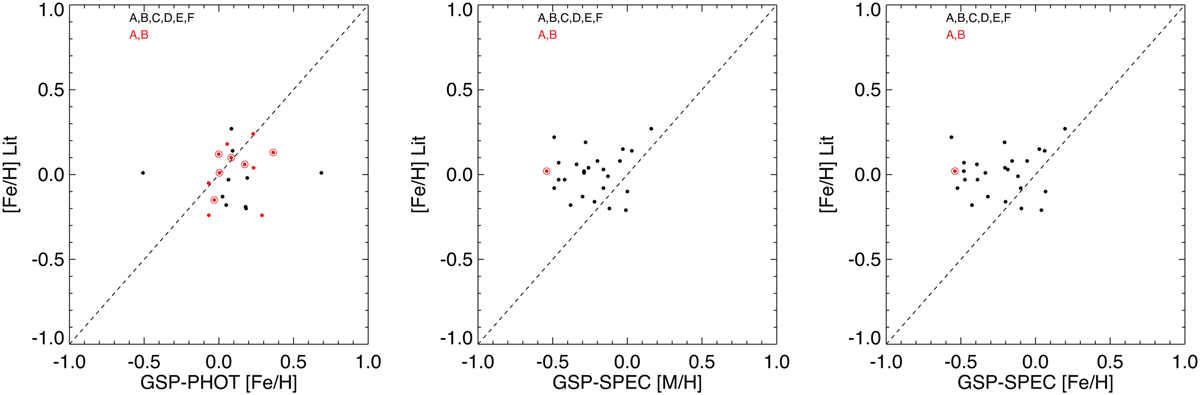
Fig. 3
Download original image
[Fe/H] values from spectroscopic published works versus the [Fe/H] values inferred by the GSP-Phot and GSP-Spec module. The red filled circles are data points located in the areas A and B of the Luminosity–Teff diagram of Messineo & Brown (2019). Encircled data points are from the works of Davies et al. (2010) and Gazak et al. (2014). Left panel: [Fe/H] values from the literature versus those inferred from GSP-Phot module. Middle panel: [Fe/H] values from the literature versus the [M/H] values inferred from GSP-Spec. Right panel: [Fe/H] values from the literature versus the [Fe/H] values inferred from GSP-Spec [M/H] and GSP-Spec [α/Fe] using the formula of Ferraro et al. (1999).
Current usage metrics show cumulative count of Article Views (full-text article views including HTML views, PDF and ePub downloads, according to the available data) and Abstracts Views on Vision4Press platform.
Data correspond to usage on the plateform after 2015. The current usage metrics is available 48-96 hours after online publication and is updated daily on week days.
Initial download of the metrics may take a while.