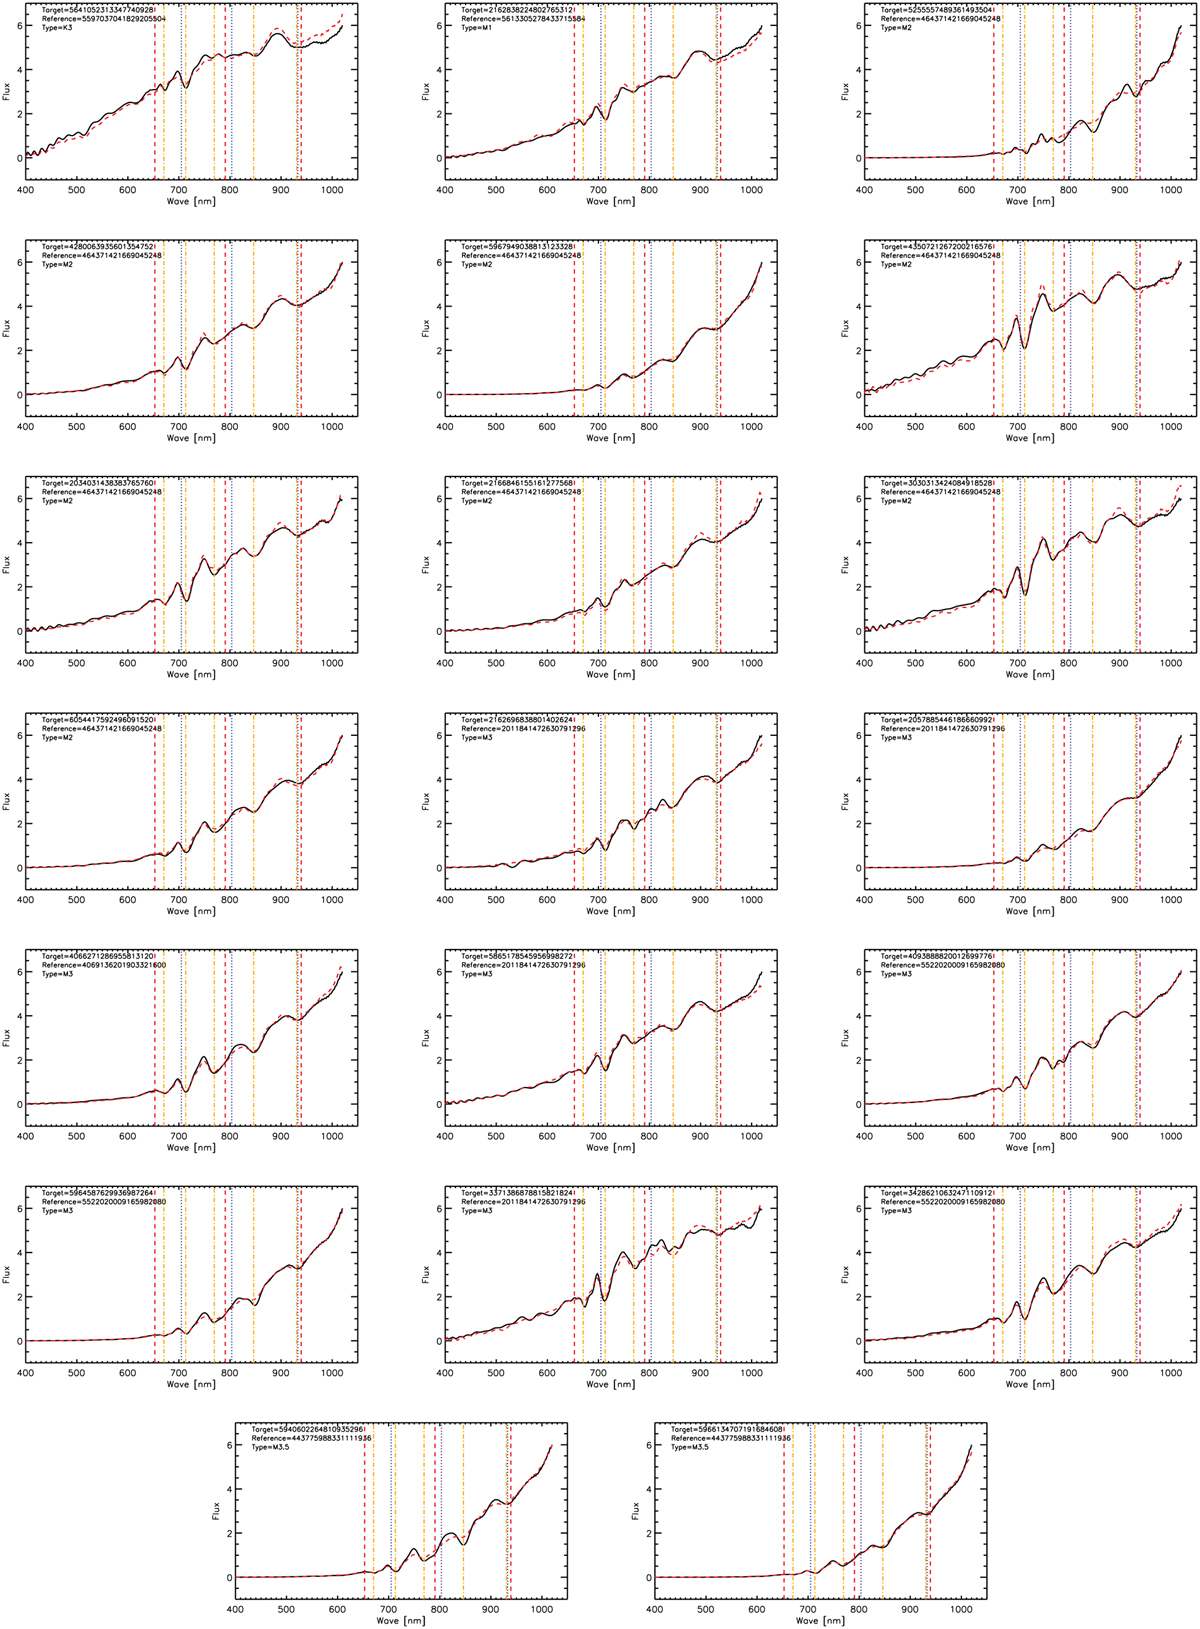
Fig. A.6
Download original image
BP/RP spectra of the newly detected very-likely RSGs, shown with a black curve. The red-dashed curves show the BP/RP spectra of stars from Messineo & Brown (2019) used as references. The reference spectra have been brought to the target extinction using the infrared-derived ![]() and the Galactic extinction curve of Cardelli et al. (1989) extended to infrared wavelengths with a power law with index −1.9 (Messineo et al. 2005). Here, again, the vertical orange dotted-dashed lines mark the locations of the main absorption bands seen in M1-M3 RSGs and O-rich stars; the vertical red lines mark the absorption seen in S-type, and the vertical blue lines are those in C-rich stars.
and the Galactic extinction curve of Cardelli et al. (1989) extended to infrared wavelengths with a power law with index −1.9 (Messineo et al. 2005). Here, again, the vertical orange dotted-dashed lines mark the locations of the main absorption bands seen in M1-M3 RSGs and O-rich stars; the vertical red lines mark the absorption seen in S-type, and the vertical blue lines are those in C-rich stars.
Current usage metrics show cumulative count of Article Views (full-text article views including HTML views, PDF and ePub downloads, according to the available data) and Abstracts Views on Vision4Press platform.
Data correspond to usage on the plateform after 2015. The current usage metrics is available 48-96 hours after online publication and is updated daily on week days.
Initial download of the metrics may take a while.