| Issue |
A&A
Volume 672, April 2023
|
|
|---|---|---|
| Article Number | A106 | |
| Number of page(s) | 21 | |
| Section | Extragalactic astronomy | |
| DOI | https://doi.org/10.1051/0004-6361/202245105 | |
| Published online | 06 April 2023 | |
Cold gas disks in main-sequence galaxies at cosmic noon: Low turbulence, flat rotation curves, and disk-halo degeneracy
1
INAF, Arcetri Astrophysical Observatory, Largo E. Fermi 5, 50125 Florence, Italy
e-mail: This email address is being protected from spambots. You need JavaScript enabled to view it.
2
School of Astronomy and Space Science, Nanjing University, 163 Xianlin Avenue, Nanjing, Jiangsu 210023, PR China
3
Key Laboratory of Modern Astronomy and Astrophysics, Nanjing University, Ministry of Education, Nanjing 210023, PR China
4
Research Center for Intelligent Computing Platforms, Zhejiang Laboratory, Hangzhou 311100, PR China
5
Universität zu Köln, I. Physikalisches Institut, Zülpicher Str. 77, 50937 Köln, Germany
6
Department of Physics, Section of Astrophysics, Astronomy and Mechanics, Aristotle University of Thessaloniki, 54124 Thessaloniki, Greece
7
School of Physics and Astronomy, Cardiff University, Queens Buildings, The Parade, Cardiff CF24 3AA, UK
8
Department of Physics, University of Oregon, 461 Willamette Hall, Eugene, OR 97403, USA
9
Department of Physics & Astronomy, University of Florence, via G. Sansone 1, 50019 Sesto Fiorentino, Italy
10
INAF, Padova Astronomical Observatory, Vicolo Osservatorio 5, 35122 Padova, Italy
11
Department of Astronomy, Case Western Reserve University, 10900 Euclid Avenue, Cleveland, OH 44106, USA
Received:
30
September
2022
Accepted:
30
January
2023
Abstract
We study the dynamics of cold molecular gas in two main-sequence galaxies at cosmic noon (zC-488879 at z ≃ 1.47 and zC-400569 at z ≃ 2.24) using new high-resolution ALMA observations of multiple 12CO transitions. For zC-400569 we also reanalyze high-quality Hα data from the SINS/zC-SINF survey. We find that (1) both galaxies have regularly rotating CO disks and their rotation curves are flat out to ∼8 kpc contrary to previous results pointing to outer declines in the rotation speed Vrot; (2) the intrinsic velocity dispersions are low (σCO ≲ 15 km s−1 for CO and σHα ≲ 37 km s−1 for Hα) and imply Vrot/σCO ≳ 17 − 22 yielding no significant pressure support; (3) mass models using HST images display a severe disk-halo degeneracy, that is models with inner baryon dominance and models with “cuspy” dark matter halos can fit the rotation curves equally well due to the uncertainties on stellar and gas masses; and (4) Milgromian dynamics (MOND) can successfully fit the rotation curves with the same acceleration scale a0 measured at z ≃ 0. The question of the amount and distribution of dark matter in high-z galaxies remains unsettled due to the limited spatial extent of the available kinematic data; we discuss the suitability of various emission lines to trace extended rotation curves at high z. Nevertheless, the properties of these two high-z galaxies (high Vrot/σV ratios, inner rotation curve shapes, bulge-to-total mass ratios) are remarkably similar to those of massive spirals at z ≃ 0, suggesting weak dynamical evolution over more than 10 Gyr of the Universe’s lifetime.
Key words: dark matter / galaxies: evolution / galaxies: formation / galaxies: high-redshift / galaxies: kinematics and dynamics / galaxies: structure
© The Authors 2023
 Open Access article, published by EDP Sciences, under the terms of the Creative Commons Attribution License (https://creativecommons.org/licenses/by/4.0), which permits unrestricted use, distribution, and reproduction in any medium, provided the original work is properly cited.
This article is published in open access under the Subscribe to Open model. This email address is being protected from spambots. You need JavaScript enabled to view it. to support open access publication.
1. Introduction
During the past decades, there has been outstanding progress in studying the internal dynamics of high-z galaxies. Near-infrared (NIR) spectroscopy with integral field units (IFUs) allowed for the kinematics of warm (T ≃ 104 K) ionized gas to be traced using the Hα emission line at z ≃ 1.0 − 2.5 (e.g., Förster Schreiber et al. 2009; Wisnioski et al. 2015; Stott et al. 2016) and the [O III]λ5007 Å line up to z ≃ 3.5 (e.g., Gnerucci et al. 2011; Turner et al. 2017). Radio and submillimeter observations with the Jansky Very Large Array (JVLA) and the NOrthern Extended Millimeter Array (NOEMA) allowed for the kinematics of cold neutral gas (T ≃ 10 − 100 K) to be traced using CO transitions at z ≃ 1 − 4 (e.g., Hodge et al. 2012; Übler et al. 2018). Moreover, the Atacama Large Millimeter Array (ALMA) made it possible to study gas dynamics using [C I] lines at z ≃ 1 − 3 (Lelli et al. 2018; Dye et al. 2022; Gururajan et al. 2022), the [C II] line at z ≃ 4 − 7 (De Breuck et al. 2014; Jones et al. 2017; Smit et al. 2018), and high-J CO lines (Tadaki et al. 2017; Talia et al. 2018).
The first IFU surveys of massive galaxies (M⋆ ≳ 1010 M⊙) at z ≃ 1 − 3 suggested that about one-third of star-forming galaxies were rotation-dominated disks, one-third were dispersion-dominated objects, and another third were merging systems (Förster Schreiber et al. 2009; Gnerucci et al. 2011). Subsequent observations, however, led to a drastically different picture: it is now clear that at least 80% of star-forming galaxies at z ≃ 1 − 3 have rotating gas disks, whereas dispersion-dominated and merging systems constitute a minority of the star-forming population (Wisnioski et al. 2015, 2019; Stott et al. 2016). The reasons for such a changing view are complex, but an important role has been played by the limited spatial resolution and the resulting beam-smearing effects (Warner et al. 1973; Bosma 1978; Begeman 1989). When a rotating disk is spatially resolved with only a few resolution elements, different line-of-sight velocity projections are flux-averaged within the resolution element creating two main observational effects: (1) the line profiles are artificially broadened, so a rotation-supported disk may appear as a dispersion-dominated object when observed at low spatial resolution, and (2) the line profiles become asymmetric, typically with long tails of emission toward the systemic velocity, so the gas kinematics may appear more complex than they really are. These two observational effects can then lead to an artificially high fraction of dispersion-dominated and merging systems with respect to rotation-dominated ones. The same issues may occur in low-resolution [C II] surveys of galaxies at z ≃ 4 − 7 (Le Fèvre et al. 2020; Jones et al. 2021; Neeleman et al. 2021).
While there is now overall agreement about the existence of rotating disks at high z, their kinematic properties remain debated. Kinematic studies of warm ionized gas led to the common view that high-z disks are more turbulent than their local analogs (Förster Schreiber et al. 2009; Lehnert et al. 2009; Gnerucci et al. 2011). The gas velocity dispersion (σV) is thought to increase systematically with z, while the degree of rotation support (Vrot/σV) decreases (Wisnioski et al. 2015; Stott et al. 2016; Übler et al. 2019). Low values of Vrot/σV would imply that the gas disk is not fully supported by rotation: if one aims to trace the circular velocity of a test particle in the equilibrium gravitational potential, the pressure support would need to be taken into account (the so-called asymmetric-drift correction). For example, Genzel et al. (2017) and Lang et al. (2017) found that Hα rotation curves decline in the outer region steeper than the Newtonian expectation for a thin disk, and argued that such a super-Keplerian decline is due to pressure gradients from strong, turbulent gas motions.
Kinematic studies of cold neutral gas from ALMA are painting a different picture. High-resolution observations of CO, [C I] and [C II] lines revealed the existence of gas disks with low turbulence and high Vrot/σ values at z ≃ 2 − 7 (Lelli et al. 2018, 2021; Kaasinen et al. 2020; Fraternali et al. 2021; Xiao et al. 2022; Posses et al. 2023), so the observed rotation curves do not require corrections for pressure support. Dynamically cold gas disks have also been found in gravitationally lensed galaxies, in which the effective spatial resolution is exceptionally high (∼100–500 pc) due to the magnification effect (Di Teodoro et al. 2018; Rizzo et al. 2020, 2021; Dye et al. 2022).
The cause of the disagreement between optical and submillimeter studies may be twofold. On the one hand, beam-smearing effects and their modeling may again play a role: even when a rotating disk is clearly recognized, the finite spatial resolution has nontrivial effects in assessing its kinematic properties. The artificial broadening of the emission line can lead to severe overestimates of the gas velocity dispersion, while the artificial skewness can lead to severe underestimates of the rotation velocity (e.g., Swaters et al. 2009; Di Teodoro & Fraternali 2015; Di Teodoro et al. 2016). For example, one may derive a slowly rising rotation curve even though the intrinsic rotation curve rises steeply (e.g., Lelli et al. 2010). In addition to getting observations with the highest possible spatial resolution, the best approach to account for beam-smearing effects is modeling the three-dimensional (3D) emission-line datacube in a nonparametric fashion (e.g., Corbelli & Schneider 1997; Sicking 1997; Swaters 1999; Fraternali et al. 2001, 2002; Gentile et al. 2003, 2004, 2007; Józsa et al. 2007; Swaters et al. 2009; Lelli et al. 2010, 2012a,b; Lelli et al. 2014b; Di Teodoro & Fraternali 2015).
On the other hand, the different gas phases probed by different emission lines may also play a role. At z ≃ 0, ionized gas disks tend to display higher velocity dispersions and more complex noncircular motions than atomic and molecular gas disks (e.g., Lelli 2022). A similar behavior may occur at high z. The velocity dispersions from CO lines, indeed, appear systematically smaller than those from the Hα line (Übler et al. 2019). In turn, Hα velocity dispersions seem to be smaller than those from the [O II] line and stellar absorption lines (Übler et al. 2022).
To shed new light on galaxy dynamics at cosmic noon, we present an in-depth study of two galaxies with kinematic and photometric data of the highest quality. We used the Atacama Large Millimeter/submillimeter Array (ALMA) to obtain high-resolution data of the CO(3 − 2) and CO(4 − 3) lines for a main-sequence galaxy at z ≃ 2.24: zC-400569 (Mancini et al. 2011) also known as COSMOS 0488950 (Capak et al. 2007; Mobasher et al. 2007) or COSMOS2015 0300906 (Laigle et al. 2016). This galaxy is one of the best observed object from the SINS IFU survey (Förster Schreiber et al. 2009, 2018; Genzel et al. 2017). Luckily, next to zC-400569, there is another main-sequence galaxy at z = 1.47 (COSMOS 0488879 or COSMOS2015 0301356) so we set up our ALMA observations to simultaneously target the CO(2 − 1) and CO(3 − 2) lines of this second object (see Fig. 1). For brevity, we refer to this second galaxy as zC-488879. Essentially, we got two birds with one stone.
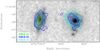 |
Fig. 1. Galaxies zC-488879 at z ≃ 1.47 (left) and zC-400569 at z ≃ 2.24 (right). The HST/WFC3 image in the NIR F160W filter (gray scale) is overlaid with CO(2 − 1) emission (green contours), CO(3 − 2) emission (blue contours), and CO(4 − 3) emission (cyan contours). Contours are at (3, 6, 12, 24) σmap with the values of 3σmap given in Table 1. The band 4 observations have lower quality than the band 3 ones, so the different spatial extent of CO(3 − 2) and CO(4 − 3) emission in zC-400569 may be due to sensitivity rather than being physical. |
Liu et al. (2019a) provide the stellar mass (M⋆) and star-formation rate (SFRs) of both galaxies by fitting their spectral energy distributions (SEDs), combining optical and NIR photometry from COSMOS with the ALMA submillimeter continuum. According to their work, zC-400569 has M⋆ = 2 × 10¹¹ M⊙ and SFR = 81 M⊙ yr−1 while zC-488879 has M⋆ = 5 × 10¹⁰ M⊙ and SFR = 115 M⊙ yr−1. Thus, both galaxies lie on the star-formation main sequence within the observed scatter (cf. with Schreiber et al. 2015).
Throughout this paper, we assume a flat Λ cold dark matter (ΛCDM) cosmology with H0 = 67.4 km s−1 Mpc−1, Ωm = 0.315, and ΩΛ = 0.685 (Planck Collaboration VI 2020). In this cosmology, 1 arcsec corresponds to 8.45 kpc at z = 2.24 and 8.68 kpc at z = 1.47. The age of the Universe and the light travel time are, respectively, 2.9 Gyr and 10.9 Gyr at z = 2.24, and 4.3 Gyr and 9.5 Gyr at z = 1.47.
2. Data analysis
2.1. ALMA observations
ALMA observations were obtained through two different projects (2017.1.01020.S and 2019.1.00862.S; PI: T. Bisbas): the first one provides low-resolution observations in band 4, while the second one is a high-resolution follow-up in both bands 4 and 3. The two galaxies (zC-400569 and zC-488879) were simultaneously observed in the same field of view, pointing toward the center of zC-400569. In both bands, we used a mixed spectral setup with four spectral windows (SPWs) with a bandwidth of 1.875 GHz each. For band-3 observations, one SPW was used to cover the CO(2 − 1) line of zC-488879, another one for the CO(3 − 2) line of zC-400569, and the remaining two SPWs for the 3-mm continuum. For band-4 observations, the four SPWs cover the CO(3 − 2) line of zC-488879, the CO(4 − 3) line of zC-400569, the [C I](1 − 0) line of zC-400569, and the 2-mm continuum. All line SPWs were covered with 1920 channels giving a channel width of 4−5 km s−1, while the continuum SPWs were covered with 128 channels giving a channel width of 60−100 km s−1.
In project 2017.1.01020.S, band-4 observations used the nominal C43-3 array configuration with 41–45 antennas, providing minimum and maximum baselines of 14 and 740 m, respectively. Three execution blocks were obtained in May 2018 giving a total on-source integration time of about 2.5 h. In project 2019.1.00862.S, bands-3 and -4 observations used the nominal C43-6 configuration with 40–45 antennas, providing minimum and maximum baselines of 14 and 3638 m, respectively. Five executions blocks were obtained in band 4 in May 2021, while six execution blocks were obtained in band 3 between May and July 2021. Unfortunately, the execution blocks taken on 11 May 2021 (band 4) and 26 May 2021 (band 3) did not reach the expected quality and are therefore not used in this study. The final on-source integration time is ∼4 h in band 3 and ∼3 h in band 4.
The data reduction was performed using the Common Astronomy Software Applications (CASA) package (McMullin et al. 2007; The CASA Team 2022). The Fourier-plane data were flagged and calibrated using the appropriate pipeline version provided by the ALMA team, which varies for different observing runs. The imaging was performed with the tclean task in CASA (version 6.1.2.7) using a Briggs’ robust parameter of 1.5 and interactive cleaning. Emission-line cubes were derived using a channel width of ∼15 km s−1 to have adequate signal-to-noise ratio (S/N). In the individual SPWs, the continuum emission is undetected, so no continuum subtraction was performed. For our kinematic analysis (Sect. 4), we use cubes without primary-beam correction, so the noise structure is uniform and well behaved. A primary-beam map is used to correct moment-one maps and calculate total fluxes (as we describe below) but the flux correction is entirely negligible for zC-400569 and only 1–2% for zC-488879 because both galaxies are well within the half-power beam-width (HPBW) of 41″ in band 3 and 62″ in band 4.
After imaging, the emission-line cubes were analyzed using the 3DBAROLO software (version 1.6; Di Teodoro & Fraternali 2015). To further boost the S/N, the cubes were Hanning smoothed over three channels using the Smoothspec task, giving a velocity resolution of 30 km s−1 and the rms noise (σcube) listed in Table 1. Subsequently, moment maps were obtained with the Makemask task, considering the signal inside a Boolean mask that was created with the Smooth & Search task. When using a mask, the noise in the moment-zero map (σmap) varies from pixel to pixel. Following Verheijen & Sancisi (2001) and Lelli et al. (2014c), we build a S/N map considering channel dependencies, then we computed a pseudo 3σmap value taking the median intensity of pixels with S/N between 2.9 and 3.1. Total line fluxes are measured summing pixels with S/N > 3 in the moment-zero maps; uncertainties are estimated repeating the sum for pixels with S/N > 2 and S/N > 4. Emission-line maps are discussed in Sect. 3, but we anticipate that our kinematic analysis in Sect. 4 fits directly the 3D cubes, modeling the effects of beam smearing on the emission-line profiles at each spatial location. Table 1 summarizes the properties of the ALMA data.
Properties of ALMA data.
2.2. SINFONI data
The SINFONI data of zC-400569 were obtained from the archive of the SINS/zC-SINF Adapative Optics (AO) survey1 (Förster Schreiber et al. 2018). We first add the WCS coordinate system to the cube and convert the third axis unit from μm to velocity assuming the Hα redshift of 2.2405 (Förster Schreiber et al. 2018). To align the cube with the north direction, we perform a rotation of 30 degrees counterclockwise at the kinematic center of the galaxy and resample the data with a pixel size of 0.05″, the same as its original value. Finally, we checked the astrometry by overlaying the moment-zero map from the SINFONI cube with images from the Hubble Space Telescope (HST), which are discussed in Sect. 2.3. The full-width half-maximum (FWHM) of the point spread function (PSF) of the SINFONI cube is ∼0.32″, while the FWHM of the line spread function is ΔV ≃ 87 km s−1 (σinst ≃ ΔV/2.35 ≃ 37 km s−1) around the Hα line (Förster Schreiber et al. 2018).
At the spatial location of the central galaxy, continuum emission is detected. The continuum emission is noisy and no stellar absorption line is detected. To estimate the continuum flux and subtract it from the SINFONI cube, we fit a first order polynomial to the line-free channels, excluding spectral regions with Hα and [N II] emission. We explored the use of higher-order polynomials but they did not significantly improved the continuum subtraction. After continuum subtraction, we checked that the flux ratios of the two [N II] lines are consistent with the theoretical value within the errors. Finally, we produced a sub-cube that covers only the Hα emission region. This continuum-subtracted Hα-only cube will be used in the rest of our analysis.
2.3. HST data
Both zC-400569 and zC-488879 have been detected by HST in various filters. Since we aim to model the stellar mass distribution of these galaxies, we analyzed the reddest HST images available in the Hubble Legacy Archive2, which were taken with the NIR F160W and F110W filters of the Wide Field Camera 3 (WFC3; Project ID 12578). The FWHM of the PSF in the F110W and F160 images are 0.13″ and 0.15″, respectively. At the redshift of zC-400569 (z ≃ 2.24), the F110W filter is comparable to rest-frame Cousins U band, while the F160W filter is in-between rest-frame V and B bands. At the redshift of zC-488879 (z ≃ 1.47), the F110W and F160W filters are comparable to rest-frame B and R bands, respectively.
The F160W image is shown in Fig. 1 overlaid with the CO moment-zero maps derived in Sect. 2.1. Overall, the HST astrometry is in good agreement with the ALMA one. For zC-400569 the peak emission in the HST image is slightly to the southwest of the centroid of the innermost CO contour, so one may have the visual impression that the HST astrometry needs to be rectified by 2–3 pixels to the top-left direction. On the other hand, for zC-488879 the peak emission in the HST image is slightly to the northeast of the centroid of the innermost CO contour, so one may have the visual impression that the HST astrometry needs to be rectified by 2–3 pixels in the opposite direction. Distortions in the HST camera cannot be so large, so the minor off-sets between stellar and CO distributions are not driven by technical issues and we apply no corrections to the HST astrometry.
We performed standard surface photometry using the ARCHANGEL software3 (Schombert 2011). ARCHANGEL has been widely used on local galaxies of all morphological types, from giant ellipticals to low-surface brightness dwarf galaxies, using images from various telescopes operating from NIR to ultra-violet bands (Tully et al. 2009, 2013; Schombert 2011, 2016, 2018; Schombert & Smith 2012; Beygu et al. 2017; Greene et al. 2019). In short, after frame cleaning and sky determination, ARCHANGEL fits elliptical isophotes to the images and derives azimuthally averaged surface brightness profiles (see previous references for details). The resulting profiles are shown in Fig. 2 for the F160W filter. The profiles from the F110W filter show a similar shape but they have larger errors, so they will not be used in the rest of this paper.
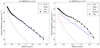 |
Fig. 2. Surface brightness profiles of zC-400569 (left panel) and zC-488879 (right panel) from the NIR F160W filter of HST/WPC3. The observed profile (black dots) is fitted with a multicomponent model (gray solid line) considering a De Vaucouleurs’ bulge (red dash-dotted line), an exponential disk (blue dashed line), and a barlens component (magenta dotted line, if present). |
For zC-400569, the surface brightness profile is well fitted by a classic bulge plus disk model, in which the bulge is described by a de Vaucouleurs (1948) profile and the disk by an exponential profile (Freeman 1970). The model has four free parameters: the effective radius and effective surface brightness of the bulge (Re, bul and μe, bul) and those of the disk (Re, disk and μe, disk). For zC-400569, the same model does not provide satisfactory results because the surface brightness profile displays a curvature at 1″ < R < 2″ that is reminiscent of “lenses” and “barlenses” in disk galaxies at z ≃ 0 (Laurikainen et al. 2011; Athanassoula et al. 2015). Thus, we add a lens-like component using a Sérsic (1963) profile with n = 0.2 and two further free parameters: Re, lens and μe, lens. Table 2 provides the results of our fits, which were performed using the orthogonal-distance-regression algorithm in the SciPy package of PYTHON (Virtanen et al. 2020). For both galaxies the bulge parameters are very uncertain (especially Re, bul) because most of the bulge light is contained within the PSF (∼0.15″ or ∼1.3 kpc for the adopted cosmology). To properly calculate the stellar gravitational potential, therefore, the bulge profile needs to be extrapolated below the HST spatial resolution (see Sect. 5).
3. Gas distribution and kinematics
3.1. The galaxy zC-400569 at z ≃ 2.4
Figure 3 compares the distributions of molecular and ionized gas in zC-400569 at z ≃ 2.24. The Hα emission display a “clumpy” morphology with a northsouth orientation. The two brightest Hα components to the north are encompassed by the CO emission, whereas the two weakest Hα components to the south are undetected in any CO line. In these two components, which we name “A” and “B”, the [N II] lines are undetected too (in agreement with Genzel et al. 2017). These two “clumps” are also visible in the HST images. Most likely, they are low-mass, low-metallicity galaxies that are interacting with the main one, as previously suggested by Genzel et al. (2017).
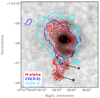 |
Fig. 3. Ionized and molecular gas in zC-400569 at z ≃ 2.24. The HST/WFC3 image in the NIR F160W filter (gray colorscale) is overlaid with Hα emission (red contours), CO(3 − 2) emission (blue contours), and CO(4 − 3) emission (cyan contours). Arrows indicate two possible dwarf companions (“A” and “B”), which are bright in Hα but undetected in CO and [N II] lines, suggesting low metallicities. |
Figure 4 provides an overview of all emission line data, showing total intensity maps, line-of-sight velocity maps, and position-velocity (PV) diagrams along the galaxy major axis (see Sect. 4 for details). The CO distribution appears smoother than the Hα distribution, but this may possibly be an effect of the lower spatial resolution. Any giant clump in molecular gas must be significantly smaller than the ALMA beam (3 − 4 kpc). The spatial distributions of CO(4 − 3) and CO(3 − 2) emission are in good agreement.
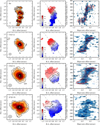 |
Fig. 4. Overview of zC-400569 at z ≃ 2.24. Left panels: total intensity maps for different emission lines, indicated in the top-left corner. Contours are at (3, 6, 12, 24) σmap with the 3σmap values given in Table 1. The white star shows the kinematic center. The gray ellipse to the bottom-left corner represents the PSF. Middle panels: velocity fields. The thick contour corresponds to the systematic velocity (set to zero) and the thin contours are in steps of ±60 km s−1. The white star shows the kinematic center and the dashed line shows the disk major axis. Right panels: position-velocity diagrams along the disk major axis. The blue colorscale shows the observed gas emission. Black contours range from 2σcube to 8σcube in steps of 2σcube. Red contour (at 2σcube and 4σcube) shows the best-fit 3D kinematic model from 3DBAROLO. The red dots show the best-fit sky-projected rotation curve. The vertical and horizontal dashed lines correspond to the galaxy center and systemic velocity, respectively. |
In terms of kinematics, CO and Hα emissions form regularly rotating disks, as shown by velocity fields and PV diagrams. This implies that stellar feedback does not destroy the overall kinematic regularity of the gas disk, similarly to the situation in local spirals where stellar feedback mostly drives a kpc-scale gas circulation via galactic fountains (e.g., Marasco et al. 2019; Li et al. 2021a). The possible interaction with components A and B appears to have a negligible effect on the overall regularity of the main disk, albeit some minor kinematic disturbances are visible toward the southeast of the velocity fields. We stress that details in the velocity fields should be interpreted with caution because of beam smearing effects; the gas kinematics is studied in Sect. 4 using 3D models.
The [C I](1 − 0) emission seems to trace the same rotating disk of the other lines but the major axis PV diagram is asymmetric and noisy. Moreover, the [C I] systematic velocity appears offset with respect to that from the Hα and CO lines. We were not able to perform a detailed kinematic analysis of the [C I] data, so we use them solely as a total H2 mass tracer in Sect. 5.3.
3.2. The galaxy zC-488879 at z ≃ 1.47
Figure 5 provides an overview of the emission-line data of zC-488879 at z ≃ 1.47. Similarly to zC-400569, the CO distribution is smooth and does not show the large clumps that are often seen in rest-frame UV and Hα images of galaxies at cosmic noon (e.g., Zanella et al. 2019). The spatial distributions of CO(3 − 2) and CO(2 − 1) emission are in overall agreement, but the CO(2 − 1) emission peaks near the galaxy center while the CO(3 − 2) emission peaks toward the south. This may be possibly related to varying CO line excitation conditions in the galaxy.
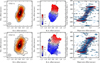 |
Fig. 5. Overview of zC-488879 at z ≃ 1.47. For the description of the panels, see the caption of Fig. 4. |
Both CO(2 − 1) and CO(3 − 2) lines indicate regularly rotating disks, as shown by velocity maps and PV diagrams. The CO(3 − 2) emission has an extension to the southwest, which is kinematically connected with the main disk and display a small velocity gradient. This extension is reminiscent of the lopsided phenomenon seen in nearby H I disks at z ≃ 0 (Baldwin et al. 1980; Sancisi et al. 2008), which may be due to minor mergers and/or gas accretion events. Deeper CO observations are necessary to clarify the nature of this outer extension.
4. Kinematic models
4.1. Nonparametric 3D fitting
We model the gas kinematics in a nonparametric fashion without a-priori assumption on the gas density profile, rotation curve shape, and gravitational potential. This is important because beam-smearing effects depend on several unknown quantities, such as the intrinsic gas distribution and rotation-curve shape (Warner et al. 1973; Begeman 1989). Parametric 3D models assume predefined functions for the rotation-curve shape and the gas density profile, so they necessarily make implicit assumptions on the intrinsic strength of beam-smearing effects. For example, an intrinsically flat rotation curve down to small radii leads to more severe beam-smearing effects than an intrinsically rising rotation curve. As a result, parametric models may only partially account for beam-smearing effects. In addition, parametric models do not provide an actual derivation of the rotation curve because a smooth shape is imposed, neglecting possible real features (such as bumps and wiggles) that are often seen in rotation curves at z ≃ 0 (e.g., Sancisi 2004; Lelli et al. 2016a). On the other hand, parametric models have the advantage of having less free parameters than tilted-ring fits and may represent the only viable method to model rotating disks that are resolved with less than 2–3 resolution elements (e.g., Bouché et al. 2015).
The task 3Dfit of 3DBAROLO (Di Teodoro & Fraternali 2015) performs a tilted-ring modeling (Warner et al. 1973; Rogstad et al. 1974; Begeman 1989) fitting the 3D cube rather than 2D moment maps, so beam-smearing effects on each single line profile are taken into account. The disk is divided in a set of rings, where each ring is characterized by five geometric parameters − center’s coordinates (x0, y0), systemic velocity (Vsys), position angle (PA), and inclination angle (i) − and five physical parameters − surface density (Σgas), vertical thickness (z0), rotation velocity (Vrot), radial velocity (Vrad), and velocity dispersion (σV).
We use rings with a width of  , where a and b are the major and minor axes of the synthesized beam. We adopt a fully axisymmetric disk, so the surface density of each ring is directly computed from the observed moment-zero map using azimuthal averages (option Norm=Azim). For the vertical density distribution, we assume an exponential law (option Ltype=3) with a fixed scale height of 100 pc: the precise value of z0 is expected to have virtually no effects on our results considering the ALMA beam size of 3 − 4 kpc. We also set Vrad = 0 because there is no strong evidence of radial motions in the velocity maps, such as a clear nonorthogonality between the kinematic major and minor axis (see, e.g., Lelli et al. 2012a,b for galaxies where Vrad ≠ 0). Thus, we are left with seven free parameters in each ring. The systemic velocity is set to zero at the fiducial redshift of the galaxies (given in Table 1) but is kept as a free parameter to account for minor adjustments in units of km s−1.
For data with relatively low S/N and resolution (as for most high-z galaxies), automated fitting codes such as 3DBAROLO must be used with caution. Firstly, it is important to define a proper mask within which the residuals are evaluated. After various trials, we find that this mask should be conservative to avoid that pixels with low S/N bias the fit. To build such a mask, we use the task Smooth & Search with parameters Factor=1.5 (factor for spatial smoothing), Snrcut=4 (primary S/N threshold), Growthcut=3 (secondary S/N threshold when growing the initial mask), and Minchannels=3 (minimum number of channels for a detection to be accepted, considering that the data have been Hanning smoothed over 3 channels). Next, our fitting strategy consists of three main steps: setting the disk geometry (Sect. 4.2), measuring the gas velocity dispersion (Sect. 4.3), and tracing the rotation curve (Sect. 4.4).
4.2. Disk geometry
We run 3Dfit on each cube leaving all seven parameters free. In this first fit, all pixels are uniformly weighted (option Wfunc=0). After various trials, we find that some best-fit parameters may slightly depend on some of the initial estimates, so we provide sensible initial guesses: PA = 35° and i = 50° for zC-400569 and PA = −20° and Vsys = 50 km s−1 for zC-488879. Initial estimates for all the other parameters are automatically estimated by 3DBAROLO. Next, we determine the geometric parameters taking the median of the best-fit values of different CO lines across all rings; uncertainties are estimated as the median absolute deviation. Thus, we fix the same disk geometry for all emission lines using the CO kinematics. We do not model warps because there is no strong indication for them in any of the data cubes at the available resolution.
The [C I](1 − 0) cube of zC-400569 has too low sensitivity to robustly determine the geometric parameters, while the Hα kinematics may bias the results due to the Hα-bright companions to the south. In addition, the Hα line could suffer from varying dust extinction across the disk, unlike the CO lines that trace the gas kinematics unbiased by such effects. The center and systemic velocity of the Hα cube, however, are determined independently from CO lines to account for possible offsets in the astrometry and/or spectral calibration of the SINFONI and ALMA data.
Table 3 summarizes our results. The geometric parameters from CO kinematics are approximately consistent with the rest-frame optical morphology of the galaxies. The inclination of zC-400569, however, is more uncertain than the formal errors from the median absolute deviation: the CO(3 − 2) line points to an inclined disk (60 − 65°), while the CO(3 − 4) and optical morphologies point to a more face-on disk (45 − 50°). Thus, we assign an error of 5° that encompasses these inclinations within 2σ.
Best-fit results from 3DBAROLO.
4.3. Gas velocity dispersion
Having fixed the disk geometry, we use the task SpacePar in 3DBAROLO to look for a global minimum in the Vrot − σV space. The parameter space is explored in steps of 1 km s−1, considering a range in σV from 1 to 60 km s−1 and a range in Vrot of 200 km s−1 centered on the expected rotation velocity. At each step, SpacePar builds a 3D disk model with given Vrot and σV, then computes the average sums of residuals Δr = |M − D|, where M and D are the flux values at each 3D pixel of model and data, respectively (default option Ftype=2). All pixels are uniformly weighted (option Wfunc=0).
For all emission lines, SpacePar returns very low values of σV of just 1 − 2 km s−1. For example, Fig. 6 shows the results for the Hα cube of zC-400569, excluding the innermost ring in which beam smearing effects are most severe and the outermost ring in which the S/N is low. Similar plots for the CO cubes are shown in Appendix A. Values of σV ≃ 1 − 2 km s−1 are physically acceptable but the minimum in the Vrot − σV space is very shallow; an intrinsic velocity dispersion of ∼10 km s−1 increases the χ2 by a mere 5%. Most likely, the available spectral resolution (ΔV), spatial resolution, and sensitivity do not allow us to robustly measure the intrinsic velocity dispersion.
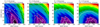 |
Fig. 6. Parameter space of rotation velocity (VROT) and velocity dispersion (VDISP) from modeling the Hα cube of zC-400569 with SpacePar. The color-scale represents χ2 values at different radii, given in the top label. The best-fit values are indicated with a cross and reported in the top label. The white contours correspond to percentage variations in χ2 from the best-fit value (2%, 5%, 10%, and 30%). Similar plots are presented in Appendix A for CO data. The small values of the velocity dispersion suggests that this quantity cannot be reliably measured because the line broadening is entirely dominated by the observational effects of spectral and spatial resolution. |
One may wonder whether the low velocity dispersions are driven by high surface brighntess pixels, which could dominate the average sum of residuals Δr. We reran SpacePar calculating  , which normalizes the residuals at each pixel to the local flux density (option Ftype=3). Again, we found formal best-fit values of σV of just 1–2 km s−1, indicating that this result is not driven by how we weight the residuals.
To further explore the situation and set a fiducial upper limit on σV, we built mock-observed cubes of rotating disks with known Vrot and σV. We smoothed the mock cubes to the same spatial and spectral resolutions of our observations, and add Gaussian noise with a peak S/N of 6 to 8, similarly to our data. We then ran SpacePar on each mock-observed cube. Independently of the input value of Vrot, when the intrinsic σV is equal or smaller than the instrumental dispersion σinst ≃ ΔV/2.35, SpacePar pushes the best-fit value of σV to the lower boundary of the explored parameter space. This is the same behavior that we obtain for all emission-line cubes of zC-400569 and zC-488879. When the intrinsic σV is slightly higher than σinst, instead, SpacePar does not push σV to the lower boundary of the explored parameter space, albeit it may not exactly recover the correct σV due to the low S/N. Thus, we conclude that σinst is a sensible upper limit for the intrinsic velocity dispersion.
Given that the ALMA cubes have a spectral resolution ΔV ≃ 30 km s−1, the formal upper limit on the CO velocity dispersion (σCO) is about 13 km s−1. To be conservative, we adopt the channel width of 15 km s−1 as our upper limit on σCO. Given the SINFONI spectral resolution ΔV ≃ 86 km s−1 around the Hα line (Förster Schreiber et al. 2009), we adopt an upper limit of 37 km s−1 on the Hα velocity dispersion (σHα). We stress that these upper limits are themselves uncertain: while the low spectral and spatial resolutions increase the line broadening leading to an overestimate of the intrinsic σV, the low S/N may lead to an underestimate of the intrinsic σV.
To check the robustness of our upper limits, we created observed cubes with a channel width of 5 km s−1 and spectral resolution of 10 km s−1 (after Hanning smoothing). These cubes have significantly lower sensitivity than the cubes at 30 km s−1 resolution. In fact 3DBAROLO does not detect the source in most of them apart from the CO(4 − 3) cube of zC-400569 and the CO(3 − 2) cube of zC-488879. For these two CO cubes, SpacePar provides σCO ≃ 4 − 12 km s−1, which may be considered as proper measurements because σinst ≃ 4 km s−1. Given the low S/N of these cubes, however, we prefer to be conservative and base all our conclusions on the upper limit σCO < 15 km s−1.
4.4. Rotation curves
Fixing the velocity dispersion to its formal upper limit, we run 3Dfit using only Vrot as a free parameter in each ring. This provides the observed rotation curve for each emission line. In this last fit, pixels are weighted according to the function cos2(θ), where θ is the azimuthal angle around the major axis (option Wfunc=2). Thus, pixels around the major axis are maximally weighted to maximize information on rotational velocities.
The right panels of Figs. 4 and 5 compare major-axis PV diagrams from the observed cubes with those from our best-fit 3D disk models. The best-fit rotation curves are projected on the PV diagrams as Vrotsin(i). Overall, the 3D disk models give a good description of the observations. In particular, the observed thickness of the PV diagrams (the line broadening at each radius) is well reproduced, indicating that the assumed velocity dispersion is sensible. The bulk of the observed line broadening, indeed, is driven by beam-smearing effects, not by the intrinsic gas velocity dispersion. Another known effect of severe beam smearing is that the best-fit rotation velocities are not necessarily near the peak of the emission line along the major axis, but they are closer to the uppermost and lowermost velocity edges of the PV diagrams. Similar rotation curves, indeed, could be obtained using the “envelope-tracing method”, which considers the terminal velocity near the lowest density contour in a PV diagram (e.g., Sofue & Rubin 2001). The envelope-tracing method was originally developed for edge-on galaxies (Sancisi & Allen 1979) but can be applied in poorly resolved galaxies too because multiple line profiles are flux-averaged within the PSF (similarly to the line-of-sight integration in edge-on disks), so the true rotation velocity corresponds to the terminal velocity near the edge of the emission, not the velocity near the peak of the emission.
The rotation curves are shown in Fig. 7. Reassuringly, different emission lines provide consistent results, suggesting that the various gas phases are kinematically settled. The observed rotation velocities imply Vrot/σCO ≳ 17 for zC-400569 and Vrot/σCO ≳ 22 for zC-488879, so there is no need to apply corrections for pressure support (asymmetric drift). Overall, the different gas tracers point to the same result: flat rotation curves with no clear signs of a decline in the outer parts.
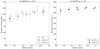 |
Fig. 7. Rotation curves of zC-400569 (left) and zC-488879 (right). Different symbols show velocity measurements from different emission lines: green squares for CO(2 − 1), blue circles for CO(3 − 2), cyan squares for CO(4 − 3), and red stars for Hα. |
3DBAROLO provides asymmetric errors (δ+, δ−) that correspond to a variation of 5% of the residuals from the global minimum. We compute symmetric 1σ errorbars as  , which will be used as weights in subsequent Bayesian fits (Sect. 5.2). For zC-400569, rotation velocities from the CO(4 − 3) line have the smallest uncertainties, while those from the Hα have the largest ones due to the relative S/N of the data. For zC-488879, rotation velocities from the CO(2 − 1) and CO(3 − 2) lines have comparable uncertainties.
4.5. Comparison with previous Hα studies
The Hα kinematics of zC-400569 has been previously studied by the SINS/zC-SINF team using the DYSMAL parametric code (Genzel et al. 2017, 2020; Price et al. 2021; Nestor Shachar et al. 2023). The previous Hα results are mixed in terms of both the intrinsic Hα velocity dispersion and the rotation curve shape.
Regarding the Hα velocity dispersion, we give a formal upper limit of 37 km s−1 while the SINS/zC-SINF team reports actual measurements: 34 km s−1 (Genzel et al. 2017, consistent with our upper limit), 45 km s−1 (Genzel et al. 2020),  km s−1 (Price et al. 2021), and 58 ± 5 km s−1 (Nestor Shachar et al. 2023). We do not fully understand why the SINS/zC-SINF team finds significantly different velocity dispersions from the same IFU data, but these varying values are in line with our basic conclusion: the Hα velocity dispersion of zC-400569 cannot be reliably measured with the existing data. This demonstrates that fitting methodologies can play a major role in obtaining measurements and/or upper limits of σV from poorly resolved data with low S/N.
Regarding the Hα rotation curve, our measurements and previous ones differ in both the inner and outer parts. In the inner parts, the Hα rotation curve from DYSMAL fits (Genzel et al. 2017, 2020; Price et al. 2021; Nestor Shachar et al. 2023) rises until R ≃ 0.4″ whereas our rotation curve is already flat. As far as we understand, the previous Hα works show the beam-smeared rotation curve, not the intrinsic one such as that provided by 3DBAROLO (Fig. 7), so the differences in the inner rotation velocities can be ascribed to beam-smearing effects (e.g., Lelli et al. 2010). In the outer parts, the Hα rotation curve from DYSMAL 1D fits (Genzel et al. 2017, 2020; Nestor Shachar et al. 2023) shows a mild decline, whereas that from DYSMAL 2D fits (Price et al. 2021) keeps rising until the last measured point at R ≃ 1″. Our 3D fits do not confirm any of these trends, but give a flat rotation curve out to R ≃ 1″. These differences are likely driven by the Hα-bright companions to the south (Fig. 3) that may hinder a precise determination of the PA, as also pointed out by Price et al. (2021). The CO data do not suffer from these complications and give a PA of 37.5°; the resulting major-axis PV diagrams (Fig. 4) unambiguously show that the rotation curve is relatively flat. In fact, independently of fitting codes, one would obtain the same result by tracing the rotation curve by eye using a “human neural network” (e.g., Sancisi & Allen 1979; Verheijen & Sancisi 2001).
The different measurements of σV and Vrot from different studies imply different values of the ratio Vrot/σV, which determine whether pressure support is relevant or not. Differently from previous studies, we conclude that the values of Vrot/σV are relatively high (≳7 for Hα and ≳17 for CO), so corrections for pressure support (asymmetric drift) are negligible. Thus, the observed rotation speeds trace the circular velocity of a test particle in the equilibrium gravitational potential and can be safely used to build mass models. In the case of zC-400569, the value of σV plays the key role because the absolute differences in Vrot from different studies are relatively small, apart from the overall difference in rotation-curve shape.
5. Mass models
5.1. Baryonic gravitational contributions
We fit the rotation curves with mass models that includes different gravitational contributions. We start with mass models that contain only baryonic components (Sect. 5.3), then mass models that also include a dark matter (DM) halo (Sect. 5.4), and finally mass models in the context of Milgromian dynamics (MOND; Sect. 5.5). In this section we describe the calculation of the Newtonian baryonic contributions: Vbul from the stellar bulge, Vdisk from the stellar disk, and Vgas from the cold gas disk.
The contribution of each baryonic component is computed using the task ROTMOD in the Gipsy software (Vogelaar & Terlouw 2001). The total baryonic contribution is then given by
 (1)
(1)
where Υi = Mi/(1010 M⊙) are dimensionless factors. Basically, for numerical convenience, the gravitational contribution of each component is computed for an arbitrary mass of 1010 M⊙ and rescaled using fitting parameters Υi on the order of one. The total baryonic mass of the model is then given by
 (2)
(2)
The gravitational contribution of the stellar bulge is computed assuming spherical symmetry, deprojecting a given 2D surface density profile (Kent 1986). We adopt a de Vaucouleurs (1948) profile for which Re, bul is fixed from fits of the observed surface brightness profile (Sect. 2.3). Thus, the only free parameter is Mbul or equivalently Υbul. Importantly, it is necessary to extrapolate the bulge profile at radii smaller than the HST spatial resolution (∼1.3 kpc) otherwise the innermost points of the rotation curve would not be correctly reproduced. Differences in Vbul between spherical and oblate geometries are on the order of 10%−20% (Noordermeer 2008) and degenerated with Mbul, which is much more uncertain than that.
The gravitational contribution of the stellar disk is computed considering a disk of finite thickness with a given density profile ρ(R, z) = Σ(R)ζ(z) (Casertano 1983). For the radial density distribution Σ(R), we use the best-fit model to the observed surface brightness profile after subtracting the bulge component (Sect. 2.3). Thus, for zC-400569 we adopt a pure exponential disk, while for zC-488879 the disk term includes an exponential plus a barlens-like component (see Fig. 2). Differently from mass modeling at z ≃ 0 (Lelli et al. 2016a), we use parameteric models for the radial density profile because they need to be extrapolated at R < 1.3 kpc due to limited spatial resolution of the available images. For the vertical density distribution ζ(z), we assume an exponential function with constant scale height zdisk. We estimate zdisk using the scaling relation zdisk = 0.196 (Re, disk/1.68)0.633 that holds for edge-on disk galaxies at z ≃ 0 (Bershady et al. 2010). The vertical geometry has a small effect on the resulting Vdisk: at fixed Mdisk a thick disk gives a smaller velocity contribution than a thin disk at small radii (Casertano 1983). The uncertainties on Mdisk, however, are significantly larger than plausible variations in zdisk, so there is little value in leaving zdisk free in the fit.
The gravitational contribution of the gas disk is computed in a similar fashion as the stellar disk. For the radial density distribution, we use the observed CO(3 − 2) profile for zC-400569 and the observed CO(2 − 1) profile for zC-488879 because they are the lowest CO transitions available, which are expected to best trace the H2 surface density distribution irrespective of the ambient conditions (such as gas density and kinetic temperature). For the vertical density distribution, we assume an exponential profile with a constant scale height of 100 pc, which is reasonable for a cold gas disk with Vrot/σV ≳ 20. Our computation of Vgas neglects the contribution of atomic gas (H I), which may dominate the total gas budget of high-z galaxies (Chowdhury et al. 2022). In the inner regions of local spirals, however, the H2 surface densities usually dominate over the H I surface densities, so the gas gravitational contribution is mostly due to H2 at R ≲ 5 − 10 kpc while H I prevails at larger radii (Martinsson et al. 2013; Frank et al. 2016). According to theoretical models of the interstellar medium (ISM), the transition from atomic to molecular gas depends mostly on local properties (such as pressure, metallicity, and far-UV radiation) and is expected to be spatially abrupt once the H I-to-H2 phase transition criterion is satisfied, leading to a nearly fully molecular ISM (Elmegreen 1989, 1993; Papadopoulos et al. 2002; Offner et al. 2013). Given that we extract rotation curves using CO lines, it is safe to assume that these CO-bright regions are well within the H I-to-H2 phase transition radius, thus dominated by molecular gas (Bisbas et al. 2021).
5.2. Bayesian likelihood and priors
The parameters of the mass models are determined using a Markov-chain-Monte-Carlo (MCMC) method in a Bayesian context. We define the likelihood ℒ = exp(−0.5χ2) with
![Mathematical equation: $$ \begin{aligned} \chi ^2 = \sum _{k}^{N} \frac{[V_{\rm rot} - V_{\rm mod}(\boldsymbol{p})]^{2}}{\delta ^{2}_{V_{\rm rot}}}, \end{aligned} $$](/articles/aa/full_html/2023/04/aa45105-22/aa45105-22-eq12.gif) (3)
(3)
where Vrot is the observed rotation velocity at radius Rk, δVrot is the associated error, and Vmod is the model rotation velocity that depends on the fitting parameters p. As it is often the case in Astronomy, the errors δVrot are “educated guesses” and do not truly represent a strict 1σ deviation from a Gaussian distribution. However, scaling all δVrot by an arbitrary factor would only affect the width of the posterior probability distribution but not its overall shape. This implies that we can robustly determine the best-fit model parameters p, but the associated uncertainties should be taken with a grain of salt. For each galaxy, we consider the ensemble of rotation velocity measurements from different emission lines at the same time (Fig. 7). This increases the statistical significance of our data set, allowing us to more robustly infer the optimal model parameters and associated uncertainties.
The posterior probability distributions of the model parameters are mapped using emcee (Foreman-Mackey et al. 2013). The MCMC chains are initialized with 200 walkers. We run 1000 burn-in iterations, then the sampler is run for another 2000 iterations. The emcee parameter a, which controls the size of the stretch move, is set equal to 2. In general, this gives acceptance fractions larger than 50%.
Both Vrot and δVrot depend on the disk inclination i. The value of i is constrained by kinematic fits to the emission-line cubes with uncertainties of a few degrees (Sect. 4.2). Thus, we treat i as a nuisance parameter using a Gaussian prior with central value i0 and standard deviation δi0 set equal to the kinematic estimates from 3DBAROLO. Then, Vrot and δVrot transform as sin(i0)/sin(i).
Fitting rotation curves can be a strongly degenerate problem (e.g., Li et al. 2019, 2020, 2021b). For both galaxies, indeed, the velocity contributions Vgas and Vdisk display a similar trend with radius, so the values of Υgas and Υdisk are strongly degenerate and essentially unconstrained when left entirely free. To break this degeneracy, we impose two physically motivated priors:
-
A log-normal prior on Υgas using order-of-magnitude estimates of Mgas from CO luminosities. Adopting the average line ratios R21 = LCO(2 − 1)/LCO(1 − 0) ≃ 0.85 and R31 = LCO(3 − 2)/LCO(1 − 0) ≃ 0.60 (e.g., Bisbas et al. 2021), we find Mgas ≃ 1010 − 1011 M⊙ assuming either a starburst-like conversion factor αCO ≃ 0.4 M⊙ (K km s−1 pc2)−1 or the Milky Way αCO ≃ 4.3 M⊙ (K km s−1 pc2)−1. Thus, we center the prior at log(Υgas) = 0.5 with a standard deviation of 0.5 dex.
-
A log-normal prior on μgas = Υgas/Υdisk, the ratio between gas mass and stellar mass in the star-forming disk. Considering the results of Tacconi et al. (2018) and Liu et al. (2019b) for galaxies at z ≃ 1.5 − 2.5, we center the prior at log(μgas) = 0 with a standard deviation of 0.3 dex.
These priors are used in all the mass models described in the following sections. The fitting results are summarized in Table 4.
Results from Bayesian fits to the rotation curves for different mass models.
5.3. Mass models with baryons only
Figure 8 (left panels) shows mass models considering only baryonic components, so Vmod = Vbar(Υbul, Υdisk, Υgas) in Eq. (3). Given the overwhelming evidence for the DM effect in the Universe, these mass models are not entirely physical but provide hard upper limits on stellar and gas masses; they are analogous to “maximum disk” mass models of local galaxies (van Albada et al. 1985; Starkman et al. 2018). For both galaxies, the rotation curve is well reproduced with no need of DM. Similarly to local spiral galaxies, the bulge dominates the inner galaxy regions, while the stellar and gas disks become important at larger radii. Differently from local galaxies, however, the molecular gas disk dominates over the stellar disk. This result is partially driven by our assumed priors (see Sect. 5.2): the relative contributions of Vgas and Vdisk would be nearly unconstrained if left entirely free. The ratio Mbul/Mbar, instead, is a robust quantity because Vbul declines with radius while Vdisk and Vgas rise. For zC-400569 we find Mbul/Mbar ≃ 0.2, comparable to late-type spirals (Sc or Sb), while for zC-488879 we find Mbul/Mbar ≃ 0.5, comparable to early-type disks (Sa or S0).
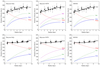 |
Fig. 8. Mass models for zC-400569 (top panels) and zC-488879 (bottom panels) using only baryonic components (left), baryons plus a NFW halo (middle) and baryons in a MOND context (right). In all panels, the observed rotation curve (dots with errorbars) is fitted considering the gravitational contributions of a gas disk (green dotted line), a stellar disk (blue dashed line), a stellar bulge (red dash-dotted line, if present), and a DM halo (magenta dash-dotted line, if present). |
We compare the stellar masses (M⋆ = Mbul + Mdisk) from our dynamical model with those independently measured from SED fitting using automated pipelines (Liu et al. 2019a). For zC-400569, we find  M⊙ that is consistent with the SED value of (21.9 ± 6.5)×1010 M⊙ at the 2σ level. For zC-488879, we find
  that is significantly different from the SED value of (5.2 ± 1.2)×1010 M⊙ at the 3σ level. The high stellar mass of this galaxy is dominated by the bulge component, which is unavoidably needed to explain the inner rotation speeds of ∼300 km s−1. This indicates that stellar masses from automated SED fitting may occasionally be uncertain up to a factor of 4.
In principle, stellar masses from SED fitting and/or galaxy colors may be improved by considering the bulge and stellar disk separately (e.g., Schombert et al. 2022). This requires spatially resolved images that are currently available only in the rest-frame UV and optical parts of the spectrum (see Sect. 2.3), which are most sensitive to the unavoidable assumptions on star-formation history, chemical enrichment, and dust extinction (e.g., Schombert et al. 2019). The situation may be improved with JWST images, probing the rest-frame NIR part of the spectrum, which is less sensitive to those assumptions and may therefore provide accurate stellar masses for the bulge and disk components separately.
As a consistency check, we compute an effective αCO = Mgas/LCO(1 − 0) in units of M⊙ (K km s−1 pc2)−1, using the gas mass from our dynamical model and the observed CO(2 − 1) and CO(3 − 2) luminosities with the assumption of average R21 = 0.85 and R32 = 0.60. We find  for zC-400569 and
  M⊙ for zC-488879. Both values are consistent with the Milky-Way αCO within the uncertainties and are within the range of values found in star-forming galaxies across cosmic time (see Table 14 in Dunne et al. 2022). For zC-400569, we make a similar consistency check for α[C I] = Mgas/L[C I](1−0) using the [C I](1 − 0) emission, which is too faint for rotation-curve measurements but is a good global tracer of the H2 mass (Papadopoulos et al. 2004). We find
 ![Mathematical equation: $ \alpha_{{[\text{ C}\,{\small\rm I}]}}=6.9^{+1.9}_{-2.4} $](/articles/aa/full_html/2023/04/aa45105-22/aa45105-22-eq51.gif) which is in tension at more than 4σ with the latest calibration of 17.0 ± 0.3 from Dunne et al. (2022) using a sample of 407 galaxies across cosmic time. Our value, however, is very close to α[[C I] = 7.3 found by Crocker et al. (2019) in 18 nearby galaxies using spatially resolved, multitransition CO and [C I] observations. It is also consistent with theoretical expectations from 3D astrochemical simulations (Bisbas et al. 2021).
which is in tension at more than 4σ with the latest calibration of 17.0 ± 0.3 from Dunne et al. (2022) using a sample of 407 galaxies across cosmic time. Our value, however, is very close to α[[C I] = 7.3 found by Crocker et al. (2019) in 18 nearby galaxies using spatially resolved, multitransition CO and [C I] observations. It is also consistent with theoretical expectations from 3D astrochemical simulations (Bisbas et al. 2021).
5.4. Mass models adding a dark matter halo
Figure 8 (middle panels) shows mass models including a DM halo. From a statistical perspective, adding a DM halo with additional free parameters is not necessary because the rotation curves are already well fitted by the baryon-only mass model. The following models, however, allow us to check whether the existing data are consistent with expectations from ΛCDM cosmology.
We assume a spherical DM halo with a Navarro-Frenk-White (NFW) density profile (Navarro et al. 1996), which has two free parameters: the halo concentration C200 and the halo mass M200 (or equivalently the halo velocity V200). These quantities are defined in the same way as in Li et al. (2020). Since the observed rotation curve can be fully explained by baryons, the halo parameters cannot be constrained using only the kinematic data. Thus, we impose two ΛCDM scaling relations as Bayesian priors (following Li et al. 2020): (1) the M⋆ − M200 relation from abundance−matching techniques, and (2) the M200 − C200 relation from cosmological N-body simulations. Specifically, we impose the M⋆ − M200 relations derived by Legrand et al. (2019) at z = [1.1 − 1.5] and z = [2.0 − 2.5] on zC-488879 and zC-400569, respectively. Similarly, the mass-concentration relations from Dutton & Macciò (2014) at z ≃ 1 and z ≃ 2 are imposed on zC-488879 and zC-400569, respectively. We also consider the redshift-dependent scatters given by Legrand et al. (2019) on log(M200) and by Dutton & Macciò (2014) on log(C200). Both scatters are on the order of 0.1 dex.
With respect to the baryons-only model, the MCMC fits decrease the gravitational contributions of stellar and gas disks to leave room for the DM contribution. The bulge contribution, instead, is almost unchanged given its characteristic declining shape, so the value of Mbul/Mbar increases for both galaxies. For zC-400569, the best-fit masses decrease by a factor of ∼1.7 in stars and ∼2.1 in gas, while for zC-488879 they decrease by a factor of ∼1.4 in stars and ∼3.1 in gas. The actual uncertainties on stellar and gas masses of high-z galaxies are surely as large as a factor of 3, so we cannot categorically rule out the scenario in which the DM halo is dynamically important in the inner galaxy regions (R ≲ 8 − 9 kpc). Moreover, the best-fit parameters lie on the M⋆ − M200 and M200 − C200 relations (imposed as priors) within the uncertainties. Thus, we conclude that the observed rotation curves are consistent with “cuspy” ΛCDM halos due to a severe disk-halo degeneracy, as we discuss in Sect. 6.5.
5.5. Mass models in Milgromian dynamics
Milgromian dynamics (MOND; Milgrom 1983a,b,c) is the major alternative to particle DM. The MOND paradigm modifies the laws of gravity and/or inertia when accelerations are smaller than an acceleration scale a0 ≃ 10−10 m s−2, which is typical for the outer parts of spiral galaxies (see Famaey & McGaugh 2012; Milgrom 2014; Banik & Zhao 2022, for reviews). The rotation curves of the two galaxies studied here are limited to the inner high-acceleration regions where  , so they are expected to probe the Newtonian regime of the theory. Still, it is important to test MOND in these high-z galaxies for various reasons: (1) the MOND acceleration scale may possibly vary with cosmic time; (2) the ΛCDM relation between angular distance (DA) and redshift may not apply in a MOND cosmology, so rotation curve fits of high-z galaxies may provide empirical constraints on the DA(z) relation in MOND; (3) the MOND interpolation function, linking the Newtonian and Milgromian regimes, may not be constant with cosmic time.
Constraining the redshift evolution of a0 is particularly important (Milgrom 2017). Empirically, it is known that a0 ≃ c × H0 and  , where c is the speed of light and Λ is the cosmological constant. Both equivalences may be mere numerical coincidences, or they may have a deeper physical meaning. For example, the first coincidence may suggest that a0(z) = c × H(z), while the second one that a0 does not vary with z.
We perform MOND fits assuming (1) the empirical value a0 = 1.2 × 10⁻¹⁰ m s−2 found at z = 0 (e.g., Lelli 2022), (2) the theoretical DA − z relation from ΛCDM, which is expected to hold in some relativistic MOND theories (Skordis & Złośnik 2021), and (3) the interpolation function that best fits the empirical radial acceleration relation (RAR) at z ≃ 0 (McGaugh et al. 2016; Lelli et al. 2017). Figure 8 (right panels) shows the mass models from MOND fits. With respect to the baryon-only Newtonian mass models, the stellar and gas masses are decreased by 10%−30% due to a moderate MOND effect at large radii. The resulting values of M⋆ and Mgas are physically acceptable as discussed in Sect. 5.3. This implies that rotation curves at z ≃ 1 − 2 are compatible with the value of a0 and the interpolation function measured at z ≃ 0.
6. Discussion
6.1. Rotation versus pressure support in high-z galaxies
In Sect. 4.3 we find that the CO velocity dispersion of both zC-400569 and zC-488879 is surprisingly low. We cannot robustly measure σCO because the observed line broadening is fully dominated by the effects of spatial and spectral resolution, so we have a fiducial upper limit of 15 km s−1 set by the spectral resolution. The resulting lower limits in the Vrot/σCO ratio are on the order of 17–22, so the molecular gas disk is fully supported by rotation and there is no need of corrections for pressure support. These properties are comparable to those of spiral galaxies at z ≃ 0: local CO disks typically have σCO ≃ 5 − 15 km s−1 (Mogotsi et al. 2016; Bacchini et al. 2020) and Vrot/σCO ≃ 5 − 50, with lower Vrot/σCO values at small radii and higher Vrot/σCO values in the outer parts (see Appendix in Bacchini et al. 2020). In addition, ALMA observations at exceptionally high spatial resolutions (10 − 30 pc) revealed that local galaxies can host nuclear CO disks with extremely low velocity dispersions of just 1 − 2 km s−1 and Vrot/σCO ≳ 100 (Davis et al. 2017, 2018). This fact hints at the possibility that, even at z ≃ 0, velocity dispersions from CO data with moderate spatial (∼500 pc) and spectral (∼5 km s−1) resolutions may be inflated by observational effects. Evidently, measuring the intrinsic velocity dispersion of a rotating disk is not a trivial exercise.
Figure 9 (left panel) shows the redshift evolution of σV inferred by Übler et al. (2019) using both IFU data of ionized gas and NOEMA data of molecular gas. We also show the prediction of a toy model based on the Toomre-instability criterion, which was built by Wisnioski et al. (2015) to reproduce ionized gas data at z ≲ 3.5. For comparison, we consider a small sample of galaxies that satisfy two quality criteria: (1) high-resolution ALMA data of cold gas tracers such as CO, [C I], and [C II] lines, and (2) detailed 3D kinematic modeling for consistency with the current work. In addition to the two main-sequence galaxies studied here, this sample include an AGN-host galaxy at z ≃ 2.6 with [C I](2 − 1) data (Lelli et al. 2018) and several submillimeter galaxies at z ≃ 4 − 5 with [C II] data, considering both lensed (Rizzo et al. 2020, 2021) and unlensed (Sharda et al. 2019; Lelli et al. 2021; Fraternali et al. 2021) sources. The velocity dispersions from ALMA data appear to be systematically below the expectations from IFU data of ionized gas as well as NOEMA data of molecular gas. Figure 9 (right panel) compares the Vrot/σV ratios of this sample with the model of Wisnioski et al. (2015). The Vrot/σV of galaxies with ALMA data are higher than expected from the extrapolation of the model, but comparable to those of rotation-supported spiral galaxies at z ≃ 0.
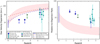 |
Fig. 9. Gas velocity dispersion (left panel) and Vrot/σV ratio (right panel) as a function of redshift. The pink band shows the model from Wisnioski et al. (2015) based on the Toomre-disk instability criterion. The dashed lines show the best-fit functions from Übler et al. (2019) using IFU data of ionized gas (red) and NOEMA data of molecular gas (blue). The points show individual galaxies that satisfy two quality criteria: (1) ALMA observations of cold gas tracers such as CO (blue points), [C I] (green), and [C II] (cyan) lines, and (2) detailed kinematic modeling with 3DBAROLO. |
In our view, it is possible that previous measurements from IFU and/or NOEMA data may have not been fully corrected for beam-smearing effects, leading to systematic overestimates of σV and underestimates of Vrot/σV (see also Di Teodoro et al. 2016). In fact, as the data quality increases, the measured velocity dispersion decreases (see Fig. 6 in Rizzo et al. 2021). In addition, ionized gas tracers may be more easily “contaminated” by large-scale wind components than H2-only tracers, leading to an artificial increase of the measured velocity dispersion (see the discussion in Lelli et al. 2018). The H I-to-H2 phase-transition criterion, indeed, is much more readily satisfied in the high-pressure regions inside the star-forming disks than in the wind regions outside them (though in some AGN and/or starburst galaxies, CO-rich H2 winds do exist). Moreover, a CO disk would correspond to lower disk scale-heights zdisk and thus smaller σV because in the vertical direction one has  , where ⟨ρ0⟩ is the average mid-plane mass density. In conclusion, it could well be that high-z disks are not as turbulent as generally thought, but more high-resolution and high-sensitivity ALMA observations are needed to confirm or refuse this possibility.
6.2. Rotation-curve shapes: Inner galaxy regions
In Sect. 4.4, we find that the rotation curves of zC-400569 and zC-488879 are flat with no sign of decline out to R ≃ 8 kpc. Different emission lines, such as CO(2 − 1), CO(3 − 2), CO(4 − 3) and Hα, provide consistent results (Fig. 7). This fact suggests that the various gas phases are kinematically settled and that the resulting rotation curve probes the equilibrium gravitational potential.
Flat rotation curves have been previously found in galaxies at z ≃ 1 using Hα kinematics from IFU data (Di Teodoro et al. 2016; Sharma et al. 2021). Specifically, Di Teodoro et al. (2016) analyzed a carefully selected sample of 18 galaxies with high-quality Hα data, while Sharma et al. (2021) studied a statistical sample of 344 galaxies with data of variable quality. Both studies used nonparametric tilted-ring modeling, so they provide the actual rotation curve on a ring by ring basis, not a functional parametrization thereof. Using parametric models, instead, Genzel et al. (2017) studied six galaxies at z ≃ 0.8 to 2.4 (including zC-400569) and found declining rotation curves at large radii. Subsequently, Genzel et al. (2020) increased their sample to 41 galaxies (including CO data from NOEMA for seven of them) and found a variety of rotation-curve shapes, from rising, to flat, to declining. A similar variety in rotation-curve shapes is found by Bouché et al. (2022) for nine galaxies at z ≃ 1, fitting parametric models to [O II] observations from MUSE.
These different results may be driven by the different modeling techniques, but they could also indicate a genuine variety among galaxies. At z ≃ 0 it is well established that the inner rotation curves (R ≲ 2 − 3Re) display a wide variety of shapes, depending on the galaxy morphology, surface brightness, and bulge-to-disk ratio (e.g., Corradi & Capaccioli 1990; Casertano & van Gorkom 1991; de Blok et al. 1996; Tully & Verheijen 1997; Noordermeer et al. 2007; Swaters et al. 2009; Lelli 2022). This evidence is nicely summarized by the so-called Renzo’s rule: “For any feature in the luminosity profile of a galaxy there is a corresponding feature in the rotation curve, and vice versa” (Sancisi 2004). Quantitatively, the inner steepness of the rotation curve, proxy of the central dynamical surface density, closely correlates with the central surface brightness, proxy of the central baryonic surface density (Lelli et al. 2013, 2014a, 2016c). Thus, it may not be surprising that a similar diversity in the inner rotation curves exists at cosmic noon, given the observed diversity in the light (or stellar mass) distribution of galaxies.
6.3. Rotation-curve shapes: Outer galaxy regions
The vast majority (if not all) of rotation curves at z ≃ 0 become flat at very large radii, outside the bright stellar component of galaxies, which can be probed with H I observations (Bosma 1981; van Albada et al. 1985; Begeman et al. 1991; Sanders & Verheijen 1998). To illustrate the situation, Fig. 10 compares the rotation curves of zC-400569 and zC-488879 with those of local galaxies from the SPARC sample (Lelli et al. 2016a). The H I rotation curves of massive spirals at z ≃ 0 reach radii out to 50 − 100 kpc, so they are much more extended than the CO or Hα rotation curves of galaxies at cosmic noon, halting at R ≃ 8 kpc. Unfortunately, the H I line is weak and cannot be detected (nor spatially resolved) in individual galaxies at z ≃ 1 − 3, probably not even with the future Square Kilometre Array at full capacity.
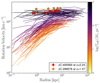 |
Fig. 10. Rotation curves of zC-400569 at z ≃ 2.24 (red dots) and zC-488879 at z ≃ 1.47 (orange stars) are compared with those of disk galaxies at z ≃ 0 from the SPARC database (Lelli et al. 2016a). The latter ones are color-coded by the mean stellar surface density within the effective radius. Rotation curves at z ≃ 0 are much more extended than those at high z thanks to the availability of H I observations. |
We stress that zC-400569 is one of the galaxy with the best IFU data (Genzel et al. 2017), so represents the current state of the art in terms of Hα kinematics at cosmic noon. In principle, to increase the sensitivity in the outer galaxy regions, one may stack the line emission of multiple galaxies after normalizing both the radial extent and the velocity extent in some way. Such stacking experiments have been performed (Lang et al. 2017; Tiley et al. 2019) but led to controversial results because the final stacked rotation curves depend on the adopted normalization, which is not surprising given the observed variety in the inner rotation-curve shapes of individual galaxies.
Generally speaking, Hα and CO emissions are cospatial with the star-forming disk, so they cannot easily probe the ubiquitous flattening of rotation curves beyond the bright stellar component of galaxies. This problem is even more prominent for the high-J CO lines (J = 3 − 2 and higher) that are routinely imaged by ALMA at high z. In fact, high-J CO lines trace only dense and warm H2 gas that is closely associated with active star-forming sites, unlike the lower-J CO lines that trace also less dense and cooler H2 phases. A possible alternative is the S(0): Ju − Jl = 2 − 0 rotational line of H2 at 28 μm that emanates from a warm molecular gas phase concomitant with the cold atomic phase in spirals (Papadopoulos et al. 2002), but there is currently no telescope to image this line in galaxies across cosmic time. The most promising line at high z is the bright [C II] emission at 158 μm, which traces a combination of atomic, molecular, and ionized gas, but this line is most easily observed by ALMA only at z > 4 (e.g., Lelli et al. 2021).
Despite all these limitations, Fig. 10 shows a remarkable fact: the inner rotation curves (R < 8 − 9 kpc) of zC-400569 and zC-488879 are very similar to those of local galaxies with similar stellar surface densities (∼103 M⊙ pc−2). This result suggests that main-sequence galaxies at cosmic noon are dynamically evolved and may turn into local spiral galaxies without the need for a major redistribution of their total mass, at least within the inner 10 kpc. This fact is in line with ALMA kinematic studies of galaxies at z > 4 (Rizzo et al. 2020, 2021; Lelli et al. 2021; Tsukui & Iguchi 2021) and recent results at z > 3 (Ferreira et al. 2022) from the James Webb Space Telescope (JWST), pointing to speedy galaxy evolution in the first billions year of the Universe’s lifetime.
6.4. The dark matter effect: Probing low accelerations
In Sect. 5.3, we find that the rotation curves of both zC-400569 and zC-488879 can be fitted with a mass model that contains only baryonic components. This occurs even though the rotation curve is flat due to the sum of a declining bulge contribution at small radii and a rising disk contribution in the outer parts (see Fig. 8). Similar mass models are common for local spirals (Lelli et al. 2016a). Historically, indeed, the evidence for the DM effect in galaxies did not come simply from “flat rotation curves” because most Hα rotation curves can be fitted by mass models with only baryonic components (Kalnajs 1983; Kent 1986). The unambiguous evidence for the DM effect came from rotation curves that remain flat outside the stellar component, beyond the peak of the disk contribution at 2 − 3Rd, such as those from deep H I observations (van Albada et al. 1985; Kent 1987; Begeman 1989; see Sanders 2014 for an historical perspective).
To illustrate the situation, Fig. 11 shows the location of zC-400569 and zC-299569 on the empirical RAR at z ≃ 0 (McGaugh et al. 2016; Lelli et al. 2017): the observed centripetal acceleration from rotation curves ( ) is plotted against that expected from the distribution of baryons (gbar = −∇ϕbar). For local galaxies, the value of gbar is well measured using Spitzer photometry at 3.6 μm, which provides a dust-free tracer of the stellar mass distribution and allows for the adoption of a common mass-to-light ratio for all galaxies (e.g., Lelli et al. 2017). For high-z galaxies, rest-frame NIR photometry is not available yet, so we need to make assumptions on stellar masses to locate them on the RAR. This is similar to the observational situation at z ≃ 0 about 20 yr ago (McGaugh 2004).
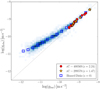 |
Fig. 11. Location of zC-400569 (red dots) and zC-488879 (orange stars) on the radial acceleration relation at z ≃ 0 (blue colorscale and open squares). For both galaxies we assume the values of Υgas, Υdisk, and Υbul from the baryons-only mass model (Sect. 5.3). Both galaxies lie on the 1:1 relation (dotted line) at high accelerations, similarly to disk galaxies at z ≃ 0. To unambiguously probe the DM effect (gobs > gbar) one needs more extended rotation curves probing lower accelerations. |
In Fig. 11, we assume the values of Υdisk, Υbul, Υdisk from the baryon-only mass model (Sect. 5.3). As expected, both high-z galaxies lie on the unity line (gobs = gbar) at accelerations higher than a few 10−9 m s−2. Clearly, lower values of Υdisk, Υbul, Υdisk (such as those found in the NFW model, Sect. 5.4) would shift gbar toward the left and move the data above the unity line. In local galaxies, the DM effect (gobs > gbar) appears at accelerations lower than ∼10−10 m s−2. If we assume that the rotation curves of our high-z galaxies remain flat at the observed values, then they should be traced out to 20 − 30 kpc to unambiguougly probe the DM-dominated regime. Unfortunately, these distances seem out of reach for Hα and CO data from existing facilities.
6.5. The disk-halo degeneracy reloaded
In Sect. 5.4, we find that the rotation curves of both zC-400569 and zC-488879 can be fitted with a NFW halo in a ΛCDM context. Adding an NFW halo comes at the expense of decreasing the disk mass by a factor of 2 − 3 with respect to the baryon-only model. As a result, for the NFW model, the DM contribution is already important in the inner galaxy regions. Given the large uncertainties on stellar and gas masses at z ≃ 1 − 3, a NFW halo cannot be categorically ruled out.
The current situation is reminiscent of the well-known “disk-halo degeneracy” (van Albada et al. 1985), which has plagued the mass modeling of galaxies for a few decades. Essentially, the halo and disk contributions are degenerate because they have a similar shape (see Fig. 8), so one needs to know the disk mass with high accuracy to determine the DM halo properties and inner DM fractions. One way to break this degeneracy is using rest-frame NIR photometry (e.g., Sanders & Verheijen 1998; Lelli et al. 2016a) because the stellar mass-to-light ratio is almost insensitive to the galaxy star-formation history, metallicity, and dust extinction (e.g., Schombert et al. 2019), so the stellar masses can be estimated with an accuracy of ∼25%. This approach gives negligible DM fractions in the inner regions of massive galaxies at z ≃ 0 (see Fig. 11). For galaxies at cosmic noon, rest-frame NIR imaging will become available soon thanks to JWST, so we will be able to break the disk-halo degeneracy at z ≃ 1 − 3.
Our conclusions differ from those of Genzel et al. (2020) and Price et al. (2021), who report high baryonic fractions and cored DM distributions in galaxies at cosmic noon (see also Bouché et al. 2022). Possibly, their findings are driven by an underrating of the disk-halo degeneracy, which may occur when the DM halo concentration is fixed and/or strong priors on stellar and gas masses are imposed. The most conservative conclusion is that it is just impossible to draw firm statements on the amount and distribution of DM in galaxies at high z with the available data. However, the various similarities between our galaxies at z ≃ 1 − 2 and massive spirals at z ≃ 0 suggest that inner baryon dominance and core DM halos may, indeed, be the most likely scenario for galaxies at the cosmic noon. This scenario may soon be tested using rest-frame NIR images from JWST.
7. Conclusions
We presented high-resolution ALMA observations of multiple CO transitions for two main-sequence galaxies at cosmic noon: zC-400569 at z ≃ 2.24 and zC-488879 at z ≃ 1.47. We also reanalyzed Hα data for zC-400569 from SINFONI at the VLT. Our main results can be summarized as follows:
-
Both galaxies have regularly rotating CO disks at R ≲ 8 kpc and show possible hints of minor mergers and/or mild interactions at larger radii;
-
The rotation curves of both galaxies are flat out to R ≃ 8 kpc and show no sign of a decline in the outer parts;
-
The CO velocity dispersion seems low (σCO ≲ 15 km s−1), smaller than the spectral resolution, so the gas disks have Vrot/σCO ≳ 17 − 22 indicating a low turbulence environment;
-
Mass models from HST images reveal a severe disk-halo degeneracy: models with inner baryon dominance and models with a NFW halo can fit the observed rotation curves equally well with acceptable stellar and gas masses;
-
Mass models in Milgromian dynamics (MOND) can fit the observed rotation curves with the same acceleration scale and interpolation function measured at z ≃ 0.
In the near future, rest-frame NIR imaging from JWST will provide accurate stellar masses (comparable to those at z ≃ 0) and allow us to distinguish between various mass models, breaking the disk-halo degeneracy. In particular, we may be able to discriminate between ΛCDM models, which predict a significant DM effect within 8 kpc, and MOND models, which do not.
In terms of galaxy evolution, the dynamical properties of these two galaxies (rotation-curve shapes, high Vrot/σV ratios, and bulge-to-total ratios) are remarkably similar to those of spiral galaxies at z ≃ 0. This fact suggests that some massive galaxies at cosmic noon undergo weak dynamical changes over more than 10 Gyr of the Universe’s lifetime, evolving into local spiral galaxies without the need of a severe mass redistribution in their inner regions.
Acknowledgments
Z.-Y.Z. and L.L. acknowledge the support of the National Natural Science Foundation of China (NSFC) under grants No. 12041305, 12173016. Z.-Y.Z. and L.L. acknowledge the science research grants from the China Manned Space Project with NOs.CMS-CSST-2021-A08 and CMS-CSST-2021-A07. Z.-Y.Z. and L.L. acknowledge the Program for Innovative Talents, Entrepreneur in Jiangsu. T.G.B. acknowledges support from Deutsche Forschungsgemeinschaft (DFG) grant no. 424563772. This paper makes use of the following ALMA data: ADS/JAO.ALMA#2017.1.01020.S and ADS/JAO.ALMA#2019.1.00862. ALMA is a partnership of ESO (representing its member states), NSF (USA) and NINS (Japan), together with NRC (Canada), MOST and ASIAA (Taiwan), and KASI (Republic of Korea), in cooperation with the Republic of Chile. The Joint ALMA Observatory is operated by ESO, AUI/NRAO and NAOJ. Based on observations made with the NASA/ESA Hubble Space Telescope, and obtained from the Hubble Legacy Archive, which is a collaboration between the Space Telescope Science Institute (STScI/NASA), the Space Telescope European Coordinating Facility (ST-ECF/ESA) and the Canadian Astronomy Data Centre (CADC/NRC/CSA).
References
- Athanassoula, E., Laurikainen, E., Salo, H., & Bosma, A. 2015, MNRAS, 454, 3843 [Google Scholar]
- Bacchini, C., Fraternali, F., Iorio, G., et al. 2020, A&A, 641, A70 [NASA ADS] [CrossRef] [EDP Sciences] [Google Scholar]
- Baldwin, J. E., Lynden-Bell, D., & Sancisi, R. 1980, MNRAS, 193, 313 [NASA ADS] [CrossRef] [Google Scholar]
- Banik, I., & Zhao, H. 2022, Symmetry, 14, 1331 [NASA ADS] [CrossRef] [Google Scholar]
- Begeman, K. G. 1989, A&A, 223, 47 [NASA ADS] [Google Scholar]
- Begeman, K. G., Broeils, A. H., & Sanders, R. H. 1991, MNRAS, 249, 523 [Google Scholar]
- Bershady, M. A., Verheijen, M. A. W., Westfall, K. B., et al. 2010, ApJ, 716, 234 [NASA ADS] [CrossRef] [Google Scholar]
- Beygu, B., Peletier, R. F., van der Hulst, J. M., et al. 2017, MNRAS, 464, 666 [NASA ADS] [CrossRef] [Google Scholar]
- Bisbas, T. G., Tan, J. C., & Tanaka, K. E. I. 2021, MNRAS, 502, 2701 [CrossRef] [Google Scholar]
- Bosma, A. 1978, PhD Thesis, University of Groningen, The Netherlands [Google Scholar]
- Bosma, A. 1981, AJ, 86, 1825 [NASA ADS] [CrossRef] [Google Scholar]
- Bouché, N., Carfantan, H., Schroetter, I., Michel-Dansac, L., & Contini, T. 2015, AJ, 150, 92 [Google Scholar]
- Bouché, N. F., Bera, S., Krajnović, D., et al. 2022, A&A, 658, A76 [NASA ADS] [CrossRef] [EDP Sciences] [Google Scholar]
- Capak, P., Aussel, H., Ajiki, M., et al. 2007, ApJS, 172, 99 [Google Scholar]
- Casertano, S. 1983, MNRAS, 203, 735 [NASA ADS] [CrossRef] [Google Scholar]
- Casertano, S., & van Gorkom, J. H. 1991, AJ, 101, 1231 [NASA ADS] [CrossRef] [Google Scholar]
- Chowdhury, A., Kanekar, N., & Chengalur, J. N. 2022, ApJ, 935, L5 [NASA ADS] [CrossRef] [Google Scholar]
- Corbelli, E., & Schneider, S. E. 1997, ApJ, 479, 244 [NASA ADS] [CrossRef] [Google Scholar]
- Corradi, R. L. M., & Capaccioli, M. 1990, A&A, 237, 36 [NASA ADS] [Google Scholar]
- Crocker, A. F., Pellegrini, E., Smith, J. D. T., et al. 2019, ApJ, 887, 105 [NASA ADS] [CrossRef] [Google Scholar]
- Davis, T. A., Bureau, M., Onishi, K., et al. 2017, MNRAS, 468, 4675 [NASA ADS] [CrossRef] [Google Scholar]
- Davis, T. A., Bureau, M., Onishi, K., et al. 2018, MNRAS, 473, 3818 [NASA ADS] [CrossRef] [Google Scholar]
- de Blok, W. J. G., McGaugh, S. S., & van der Hulst, J. M. 1996, MNRAS, 283, 18 [NASA ADS] [CrossRef] [Google Scholar]
- De Breuck, C., Williams, R. J., Swinbank, M., et al. 2014, A&A, 565, A59 [NASA ADS] [CrossRef] [EDP Sciences] [Google Scholar]
- de Vaucouleurs, G. 1948, Annales d’Astrophysique, 11, 247 [NASA ADS] [Google Scholar]
- Di Teodoro, E. M., & Fraternali, F. 2015, MNRAS, 451, 3021 [Google Scholar]
- Di Teodoro, E. M., Fraternali, F., & Miller, S. H. 2016, A&A, 594, A77 [NASA ADS] [CrossRef] [EDP Sciences] [Google Scholar]
- Di Teodoro, E. M., Grillo, C., Fraternali, F., et al. 2018, MNRAS, 476, 804 [NASA ADS] [CrossRef] [Google Scholar]
- Dunne, L., Maddox, S. J., Papadopoulos, P. P., Ivison, R. J., & Gomez, H. L. 2022, MNRAS, 517, 962 [NASA ADS] [CrossRef] [Google Scholar]
- Dutton, A. A., & Macciò, A. V. 2014, MNRAS, 441, 3359 [Google Scholar]
- Dye, S., Eales, S. A., Gomez, H. L., et al. 2022, MNRAS, 510, 3734 [NASA ADS] [CrossRef] [Google Scholar]
- Elmegreen, B. G. 1989, ApJ, 338, 178 [NASA ADS] [CrossRef] [Google Scholar]
- Elmegreen, B. G. 1993, ApJ, 411, 170 [NASA ADS] [CrossRef] [Google Scholar]
- Famaey, B., & McGaugh, S. S. 2012, Liv. Rev. Rel., 15, 10 [Google Scholar]
- Ferreira, L., Adams, N., Conselice, C. J., et al. 2022, ApJ, 938, L2 [NASA ADS] [CrossRef] [Google Scholar]
- Foreman-Mackey, D. 2016, J. Open Source Software, 1, 24 [NASA ADS] [CrossRef] [Google Scholar]
- Foreman-Mackey, D., Hogg, D. W., Lang, D., & Goodman, J. 2013, PASP, 125, 306 [Google Scholar]
- Förster Schreiber, N. M., Genzel, R., Bouché, N., et al. 2009, ApJ, 706, 1364 [Google Scholar]
- Förster Schreiber, N. M., Renzini, A., Mancini, C., et al. 2018, ApJS, 238, 21 [Google Scholar]
- Frank, B. S., de Blok, W. J. G., Walter, F., Leroy, A., & Carignan, C. 2016, AJ, 151, 94 [NASA ADS] [CrossRef] [Google Scholar]
- Fraternali, F., Oosterloo, T., Sancisi, R., & van Moorsel, G. 2001, ApJ, 562, L47 [CrossRef] [Google Scholar]
- Fraternali, F., van Moorsel, G., Sancisi, R., & Oosterloo, T. 2002, AJ, 123, 3124 [CrossRef] [Google Scholar]
- Fraternali, F., Karim, A., Magnelli, B., et al. 2021, A&A, 647, A194 [NASA ADS] [CrossRef] [EDP Sciences] [Google Scholar]
- Freeman, K. C. 1970, ApJ, 160, 811 [Google Scholar]
- Gentile, G., Fraternali, F., Klein, U., & Salucci, P. 2003, A&A, 405, 969 [NASA ADS] [CrossRef] [EDP Sciences] [Google Scholar]
- Gentile, G., Salucci, P., Klein, U., Vergani, D., & Kalberla, P. 2004, MNRAS, 351, 903 [Google Scholar]
- Gentile, G., Salucci, P., Klein, U., & Granato, G. L. 2007, MNRAS, 375, 199 [CrossRef] [Google Scholar]
- Genzel, R., Förster Schreiber, N. M., Übler, H., et al. 2017, Nature, 543, 397 [Google Scholar]
- Genzel, R., Price, S. H., Übler, H., et al. 2020, ApJ, 902, 98 [NASA ADS] [CrossRef] [Google Scholar]
- Gnerucci, A., Marconi, A., Cresci, G., et al. 2011, A&A, 528, A88 [NASA ADS] [CrossRef] [EDP Sciences] [Google Scholar]
- Greene, J. E., Veale, M., Ma, C.-P., et al. 2019, ApJ, 874, 66 [Google Scholar]
- Gururajan, G., Béthermin, M., Theulé, P., et al. 2022, A&A, 663, A22 [NASA ADS] [CrossRef] [EDP Sciences] [Google Scholar]
- Hodge, J. A., Carilli, C. L., Walter, F., et al. 2012, ApJ, 760, 11 [Google Scholar]
- Jones, G. C., Carilli, C. L., Shao, Y., et al. 2017, ApJ, 850, 180 [Google Scholar]
- Jones, G. C., Vergani, D., Romano, M., et al. 2021, MNRAS, 507, 3540 [NASA ADS] [CrossRef] [Google Scholar]
- Józsa, G. I. G., Kenn, F., Klein, U., & Oosterloo, T. A. 2007, A&A, 468, 731 [NASA ADS] [CrossRef] [EDP Sciences] [Google Scholar]
- Kaasinen, M., Walter, F., Novak, M., et al. 2020, ApJ, 899, 37 [NASA ADS] [CrossRef] [Google Scholar]
- Kalnajs, A. 1983, in Internal Kinematics and Dynamics of Galaxies, ed. E. Athanassoula, 100, 87 [NASA ADS] [Google Scholar]
- Kent, S. M. 1986, AJ, 91, 1301 [Google Scholar]
- Kent, S. M. 1987, AJ, 93, 816 [Google Scholar]
- Laigle, C., McCracken, H. J., Ilbert, O., et al. 2016, ApJS, 224, 24 [Google Scholar]
- Lang, P., Förster Schreiber, N. M., Genzel, R., et al. 2017, ApJ, 840, 92 [NASA ADS] [CrossRef] [Google Scholar]
- Laurikainen, E., Salo, H., Buta, R., & Knapen, J. H. 2011, MNRAS, 418, 1452 [Google Scholar]
- Le Fèvre, O., Béthermin, M., Faisst, A., et al. 2020, A&A, 643, A1 [Google Scholar]
- Legrand, L., McCracken, H. J., Davidzon, I., et al. 2019, MNRAS, 486, 5468 [NASA ADS] [CrossRef] [Google Scholar]
- Lehnert, M. D., Nesvadba, N. P. H., Le Tiran, L., et al. 2009, ApJ, 699, 1660 [NASA ADS] [CrossRef] [Google Scholar]
- Lelli, F. 2022, Nat. Astron., 6, 35 [NASA ADS] [CrossRef] [Google Scholar]
- Lelli, F., Fraternali, F., & Sancisi, R. 2010, A&A, 516, A11 [NASA ADS] [CrossRef] [EDP Sciences] [Google Scholar]
- Lelli, F., Verheijen, M., Fraternali, F., & Sancisi, R. 2012a, A&A, 537, A72 [NASA ADS] [CrossRef] [EDP Sciences] [Google Scholar]
- Lelli, F., Verheijen, M., Fraternali, F., & Sancisi, R. 2012b, A&A, 544, A145 [NASA ADS] [CrossRef] [EDP Sciences] [Google Scholar]
- Lelli, F., Fraternali, F., & Verheijen, M. 2013, MNRAS, 433, L30 [NASA ADS] [CrossRef] [Google Scholar]
- Lelli, F., Verheijen, M., & Fraternali, F. 2014a, A&A, 566, A71 [NASA ADS] [CrossRef] [EDP Sciences] [Google Scholar]
- Lelli, F., Verheijen, M., & Fraternali, F. 2014b, MNRAS, 445, 1694 [Google Scholar]
- Lelli, F., Fraternali, F., & Verheijen, M. 2014c, A&A, 563, A27 [NASA ADS] [CrossRef] [EDP Sciences] [Google Scholar]
- Lelli, F., McGaugh, S. S., & Schombert, J. M. 2016a, AJ, 152, 157 [Google Scholar]
- Lelli, F., McGaugh, S. S., & Schombert, J. M. 2016b, ApJ, 816, L14 [Google Scholar]
- Lelli, F., McGaugh, S. S., Schombert, J. M., & Pawlowski, M. S. 2016c, ApJ, 827, L19 [NASA ADS] [CrossRef] [Google Scholar]
- Lelli, F., McGaugh, S. S., Schombert, J. M., & Pawlowski, M. S. 2017, ApJ, 836, 152 [Google Scholar]
- Lelli, F., De Breuck, C., Falkendal, T., et al. 2018, MNRAS, 479, 5440 [Google Scholar]
- Lelli, F., Di Teodoro, E. M., Fraternali, F., et al. 2021, Science, 371, 713 [Google Scholar]
- Li, P., Lelli, F., McGaugh, S. S., Starkman, N., & Schombert, J. M. 2019, MNRAS, 482, 5106 [Google Scholar]
- Li, P., Lelli, F., McGaugh, S., & Schombert, J. 2020, ApJS, 247, 31 [Google Scholar]
- Li, A., Marasco, A., Fraternali, F., Trager, S., & Verheijen, M. A. W. 2021a, MNRAS, 504, 3013 [NASA ADS] [CrossRef] [Google Scholar]
- Li, P., Lelli, F., McGaugh, S., Schombert, J., & Chae, K.-H. 2021b, A&A, 646, L13 [NASA ADS] [CrossRef] [EDP Sciences] [Google Scholar]
- Liu, D., Lang, P., Magnelli, B., et al. 2019a, ApJS, 244, 40 [Google Scholar]
- Liu, D., Schinnerer, E., Groves, B., et al. 2019b, ApJ, 887, 235 [Google Scholar]
- Mancini, C., Förster Schreiber, N. M., Renzini, A., et al. 2011, ApJ, 743, 86 [CrossRef] [Google Scholar]
- Marasco, A., Fraternali, F., Heald, G., et al. 2019, A&A, 631, A50 [NASA ADS] [CrossRef] [EDP Sciences] [Google Scholar]
- Martinsson, T. P. K., Verheijen, M. A. W., Westfall, K. B., et al. 2013, A&A, 557, A131 [NASA ADS] [CrossRef] [EDP Sciences] [Google Scholar]
- McGaugh, S. S. 2004, ApJ, 609, 652 [NASA ADS] [CrossRef] [Google Scholar]
- McGaugh, S. S., Lelli, F., & Schombert, J. M. 2016, Phys. Rev. Lett., 117, 201101 [NASA ADS] [CrossRef] [Google Scholar]
- McMullin, J. P., Waters, B., Schiebel, D., Young, W., & Golap, K. 2007, ASP Conf. Ser., 376, 127 [Google Scholar]
- Milgrom, M. 1983a, ApJ, 270, 371 [Google Scholar]
- Milgrom, M. 1983b, ApJ, 270, 384 [Google Scholar]
- Milgrom, M. 1983c, ApJ, 270, 365 [Google Scholar]
- Milgrom, M. 2014, Scholarpedia, 9, 31410 [NASA ADS] [CrossRef] [Google Scholar]
- Milgrom, M. 2017, ArXiv e-prints [arXiv:1703.06110] [Google Scholar]
- Mobasher, B., Capak, P., Scoville, N. Z., et al. 2007, ApJS, 172, 117 [NASA ADS] [CrossRef] [Google Scholar]
- Mogotsi, K. M., de Blok, W. J. G., Caldú-Primo, A., et al. 2016, AJ, 151, 15 [NASA ADS] [CrossRef] [Google Scholar]
- Navarro, J. F., Frenk, C. S., & White, S. D. M. 1996, ApJ, 462, 563 [Google Scholar]
- Neeleman, M., Novak, M., Venemans, B. P., et al. 2021, ApJ, 911, 141 [NASA ADS] [CrossRef] [Google Scholar]
- Nestor Shachar, A., Price, S. H., Förster Schreiber, N. M., et al. 2023, ApJ, 944, 78 [NASA ADS] [CrossRef] [Google Scholar]
- Noordermeer, E. 2008, MNRAS, 385, 1359 [Google Scholar]
- Noordermeer, E., van der Hulst, J. M., Sancisi, R., Swaters, R. S., & van Albada, T. S. 2007, MNRAS, 376, 1513 [NASA ADS] [CrossRef] [Google Scholar]
- Offner, S. S. R., Bisbas, T. G., Viti, S., & Bell, T. A. 2013, ApJ, 770, 49 [CrossRef] [Google Scholar]
- Papadopoulos, P. P., Thi, W. F., & Viti, S. 2002, ApJ, 579, 270 [NASA ADS] [CrossRef] [Google Scholar]
- Papadopoulos, P. P., Thi, W.-F., & Viti, S. 2004, MNRAS, 351, 147 [Google Scholar]
- Planck Collaboration VI. 2020, A&A, 641, A6 [NASA ADS] [CrossRef] [EDP Sciences] [Google Scholar]
- Posses, A. C., Aravena, M., González-López, J., et al. 2023, A&A, 669, A46 [NASA ADS] [CrossRef] [EDP Sciences] [Google Scholar]
- Price, S. H., Shimizu, T. T., Genzel, R., et al. 2021, ApJ, 922, 143 [NASA ADS] [CrossRef] [Google Scholar]
- Rizzo, F., Vegetti, S., Powell, D., et al. 2020, Nature, 584, 201 [Google Scholar]
- Rizzo, F., Vegetti, S., Fraternali, F., Stacey, H. R., & Powell, D. 2021, MNRAS, 507, 3952 [NASA ADS] [CrossRef] [Google Scholar]
- Rogstad, D. H., Lockhart, I. A., & Wright, M. C. H. 1974, ApJ, 193, 309 [Google Scholar]
- Sancisi, R. 2004, in Dark Matter in Galaxies, eds. S. Ryder, D. Pisano, M. Walker, & K. Freeman, 220, 233 [NASA ADS] [Google Scholar]
- Sancisi, R., & Allen, R. J. 1979, A&A, 74, 73 [NASA ADS] [Google Scholar]
- Sancisi, R., Fraternali, F., Oosterloo, T., & van der Hulst, T. 2008, A&A Rev., 15, 189 [CrossRef] [Google Scholar]
- Sanders, R. H. 2014, The Dark Matter Problem (UK: Cambridge University Press) [Google Scholar]
- Sanders, R. H., & Verheijen, M. A. W. 1998, ApJ, 503, 97 [NASA ADS] [CrossRef] [Google Scholar]
- Schombert, J. 2011, Astrophysics Source Code Library [record ascl:1107.011] [Google Scholar]
- Schombert, J. M. 2016, AJ, 152, 214 [CrossRef] [Google Scholar]
- Schombert, J. M. 2018, AJ, 155, 69 [CrossRef] [Google Scholar]
- Schombert, J., & Smith, A. K. 2012, PASA, 29, 174 [NASA ADS] [CrossRef] [Google Scholar]
- Schombert, J., McGaugh, S., & Lelli, F. 2019, MNRAS, 483, 1496 [NASA ADS] [Google Scholar]
- Schombert, J., McGaugh, S., & Lelli, F. 2022, AJ, 163, 154 [NASA ADS] [CrossRef] [Google Scholar]
- Schreiber, C., Pannella, M., Elbaz, D., et al. 2015, A&A, 575, A74 [NASA ADS] [CrossRef] [EDP Sciences] [Google Scholar]
- Sérsic, J. L. 1963, Boletin de la Asociacion Argentina de Astronomia La Plata Argentina, 6, 41 [Google Scholar]
- Sharda, P., da Cunha, E., Federrath, C., et al. 2019, MNRAS, 487, 4305 [CrossRef] [Google Scholar]
- Sharma, G., Salucci, P., Harrison, C. M., van de Ven, G., & Lapi, A. 2021, MNRAS, 503, 1753 [CrossRef] [Google Scholar]
- Sicking, F. J. 1997, PhD Thesis, University of Groningen, The Netherlands [Google Scholar]
- Skordis, C., & Złośnik, T. 2021, Phys. Rev. Lett., 127, 161302 [NASA ADS] [CrossRef] [Google Scholar]
- Smit, R., Bouwens, R. J., Carniani, S., et al. 2018, Nature, 553, 178 [Google Scholar]
- Sofue, Y., & Rubin, V. 2001, ARA&A, 39, 137 [NASA ADS] [CrossRef] [Google Scholar]
- Starkman, N., Lelli, F., McGaugh, S., & Schombert, J. 2018, MNRAS, 480, 2292 [Google Scholar]
- Stott, J. P., Swinbank, A. M., Johnson, H. L., et al. 2016, MNRAS, 457, 1888 [Google Scholar]
- Swaters, R. A. 1999, PhD Thesis, University of Groningen, The Netherlands [Google Scholar]
- Swaters, R. A., Sancisi, R., van Albada, T. S., & van der Hulst, J. M. 2009, A&A, 493, 871 [NASA ADS] [CrossRef] [EDP Sciences] [Google Scholar]
- Tacconi, L. J., Genzel, R., Saintonge, A., et al. 2018, ApJ, 853, 179 [Google Scholar]
- Tadaki, K.-I., Kodama, T., Nelson, E. J., et al. 2017, ApJ, 841, L25 [NASA ADS] [CrossRef] [Google Scholar]
- Talia, M., Pozzi, F., Vallini, L., et al. 2018, MNRAS, 476, 3956 [NASA ADS] [CrossRef] [Google Scholar]
- The CASA Team (Bean, B., et al.) 2022, PASP, 134, 114501 [NASA ADS] [CrossRef] [Google Scholar]
- Tiley, A. L., Swinbank, A. M., Harrison, C. M., et al. 2019, MNRAS, 485, 934 [NASA ADS] [CrossRef] [Google Scholar]
- Tsukui, T., & Iguchi, S. 2021, Science, 372, 1201 [NASA ADS] [CrossRef] [Google Scholar]
- Tully, R. B., & Verheijen, M. A. W. 1997, ApJ, 484, 145 [NASA ADS] [CrossRef] [Google Scholar]
- Tully, R. B., Rizzi, L., Shaya, E. J., et al. 2009, AJ, 138, 323 [NASA ADS] [CrossRef] [Google Scholar]
- Tully, R. B., Courtois, H. M., Dolphin, A. E., et al. 2013, AJ, 146, 86 [NASA ADS] [CrossRef] [Google Scholar]
- Turner, O. J., Cirasuolo, M., Harrison, C. M., et al. 2017, MNRAS, 471, 1280 [Google Scholar]
- Übler, H., Genzel, R., Tacconi, L. J., et al. 2018, ApJ, 854, L24 [CrossRef] [Google Scholar]
- Übler, H., Genzel, R., Wisnioski, E., et al. 2019, ApJ, 880, 48 [Google Scholar]
- Übler, H., Förster Schreiber, N. M., van der Wel, A., et al. 2022, MNRAS, submitted, [arXiv:2210.03106] [Google Scholar]
- van Albada, T. S., Bahcall, J. N., Begeman, K., & Sancisi, R. 1985, ApJ, 295, 305 [Google Scholar]
- Verheijen, M. A. W., & Sancisi, R. 2001, A&A, 370, 765 [NASA ADS] [CrossRef] [EDP Sciences] [Google Scholar]
- Virtanen, P., Gommers, R., Oliphant, T. E., et al. 2020, Nat. Methods, 17, 261 [Google Scholar]
- Vogelaar, M. G. R., & Terlouw, J. P. 2001, ASP Conf. Ser., 238, 358 [NASA ADS] [Google Scholar]
- Warner, P. J., Wright, M. C. H., & Baldwin, J. E. 1973, MNRAS, 163, 163 [NASA ADS] [Google Scholar]
- Wisnioski, E., Förster Schreiber, N. M., Wuyts, S., et al. 2015, ApJ, 799, 209 [Google Scholar]
- Wisnioski, E., Förster Schreiber, N. M., Fossati, M., et al. 2019, ApJ, 886, 124 [Google Scholar]
- Xiao, M. Y., Wang, T., Elbaz, D., et al. 2022, A&A, 664, A63 [NASA ADS] [CrossRef] [EDP Sciences] [Google Scholar]
- Zanella, A., Le Floc’h, E., Harrison, C. M., et al. 2019, MNRAS, 489, 2792 [Google Scholar]
Appendix A: Parameter space of kinematic models
In Sect. 4.3, we used the task SpacePar of 3D BAROLO to explore the Vrot − σV parameter space, and showed the results for the Hα cube of zC-400569 (Fig. 6). Here we present the results for the CO cubes of zC-500569 (Fig. A.1) and zC-488879 (Fig. A.2). For all emission lines, we exclude the innermost ring in which the beam-smearing effects are most severe. Fig. A.1 and Fig. A.2 show that the global minimum in σV occurs at very low values of 1 − 2 km s−1, suggesting that the intrinsic gas velocity dispersion cannot be reliably measured (see Sect. 4.3 for details).
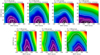 |
Fig. A.1. Same as Figure 6 but for the CO(3 − 2) cube (top panels) and CO(4 − 3) cube (bottom panels) of zC-400569. |
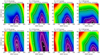 |
Fig. A.2. Same as Figure 6 but for the CO(3 − 2) cube (top panels) and CO(4 − 3) cube (bottom panels) of zC-299568. |
Appendix B: Posterior probability distributions of mass models
Figures B.1 and B.2 present “corner plots” from MCMC fits to the rotation curves (see Sect. 5), using the corner.py package (Foreman-Mackey 2016). In general, the posterior probability distributions are well-behaved and show clear peaks, indicating that the fitting quantities are well measured.
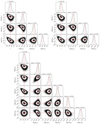 |
Fig. B.1. Corner plots for different mass models of zC-400569 (see Sect. 5): baryons only (top left), MOND (top right), and baryons plus a NFW halo (bottom). The various panels show the posterior probability distribution of pairs of fitting parameters, and the marginalized probability distribution of each fitting parameter. In the inner panels, individual MCMC samples outside the 2σ confidence region are shown with black dots, while binned MCMC samples inside the 2σ confidence region are shown by a grayscale; black contours correspond to the 1σ and 2σ confidence regions; the red squares and solid lines show median values. In the outer panels (histograms), solid and dashed lines correspond to the median and ±1σ values, respectively. |
All Tables
All Figures
|
Fig. 1. Galaxies zC-488879 at z ≃ 1.47 (left) and zC-400569 at z ≃ 2.24 (right). The HST/WFC3 image in the NIR F160W filter (gray scale) is overlaid with CO(2 − 1) emission (green contours), CO(3 − 2) emission (blue contours), and CO(4 − 3) emission (cyan contours). Contours are at (3, 6, 12, 24) σmap with the values of 3σmap given in Table 1. The band 4 observations have lower quality than the band 3 ones, so the different spatial extent of CO(3 − 2) and CO(4 − 3) emission in zC-400569 may be due to sensitivity rather than being physical. |
| In the text | |
|
Fig. 2. Surface brightness profiles of zC-400569 (left panel) and zC-488879 (right panel) from the NIR F160W filter of HST/WPC3. The observed profile (black dots) is fitted with a multicomponent model (gray solid line) considering a De Vaucouleurs’ bulge (red dash-dotted line), an exponential disk (blue dashed line), and a barlens component (magenta dotted line, if present). |
| In the text | |
|
Fig. 3. Ionized and molecular gas in zC-400569 at z ≃ 2.24. The HST/WFC3 image in the NIR F160W filter (gray colorscale) is overlaid with Hα emission (red contours), CO(3 − 2) emission (blue contours), and CO(4 − 3) emission (cyan contours). Arrows indicate two possible dwarf companions (“A” and “B”), which are bright in Hα but undetected in CO and [N II] lines, suggesting low metallicities. |
| In the text | |
|
Fig. 4. Overview of zC-400569 at z ≃ 2.24. Left panels: total intensity maps for different emission lines, indicated in the top-left corner. Contours are at (3, 6, 12, 24) σmap with the 3σmap values given in Table 1. The white star shows the kinematic center. The gray ellipse to the bottom-left corner represents the PSF. Middle panels: velocity fields. The thick contour corresponds to the systematic velocity (set to zero) and the thin contours are in steps of ±60 km s−1. The white star shows the kinematic center and the dashed line shows the disk major axis. Right panels: position-velocity diagrams along the disk major axis. The blue colorscale shows the observed gas emission. Black contours range from 2σcube to 8σcube in steps of 2σcube. Red contour (at 2σcube and 4σcube) shows the best-fit 3D kinematic model from 3DBAROLO. The red dots show the best-fit sky-projected rotation curve. The vertical and horizontal dashed lines correspond to the galaxy center and systemic velocity, respectively. |
| In the text | |
|
Fig. 5. Overview of zC-488879 at z ≃ 1.47. For the description of the panels, see the caption of Fig. 4. |
| In the text | |
|
Fig. 6. Parameter space of rotation velocity (VROT) and velocity dispersion (VDISP) from modeling the Hα cube of zC-400569 with SpacePar. The color-scale represents χ2 values at different radii, given in the top label. The best-fit values are indicated with a cross and reported in the top label. The white contours correspond to percentage variations in χ2 from the best-fit value (2%, 5%, 10%, and 30%). Similar plots are presented in Appendix A for CO data. The small values of the velocity dispersion suggests that this quantity cannot be reliably measured because the line broadening is entirely dominated by the observational effects of spectral and spatial resolution. |
| In the text | |
|
Fig. 7. Rotation curves of zC-400569 (left) and zC-488879 (right). Different symbols show velocity measurements from different emission lines: green squares for CO(2 − 1), blue circles for CO(3 − 2), cyan squares for CO(4 − 3), and red stars for Hα. |
| In the text | |
|
Fig. 8. Mass models for zC-400569 (top panels) and zC-488879 (bottom panels) using only baryonic components (left), baryons plus a NFW halo (middle) and baryons in a MOND context (right). In all panels, the observed rotation curve (dots with errorbars) is fitted considering the gravitational contributions of a gas disk (green dotted line), a stellar disk (blue dashed line), a stellar bulge (red dash-dotted line, if present), and a DM halo (magenta dash-dotted line, if present). |
| In the text | |
|
Fig. 9. Gas velocity dispersion (left panel) and Vrot/σV ratio (right panel) as a function of redshift. The pink band shows the model from Wisnioski et al. (2015) based on the Toomre-disk instability criterion. The dashed lines show the best-fit functions from Übler et al. (2019) using IFU data of ionized gas (red) and NOEMA data of molecular gas (blue). The points show individual galaxies that satisfy two quality criteria: (1) ALMA observations of cold gas tracers such as CO (blue points), [C I] (green), and [C II] (cyan) lines, and (2) detailed kinematic modeling with 3DBAROLO. |
| In the text | |
|
Fig. 10. Rotation curves of zC-400569 at z ≃ 2.24 (red dots) and zC-488879 at z ≃ 1.47 (orange stars) are compared with those of disk galaxies at z ≃ 0 from the SPARC database (Lelli et al. 2016a). The latter ones are color-coded by the mean stellar surface density within the effective radius. Rotation curves at z ≃ 0 are much more extended than those at high z thanks to the availability of H I observations. |
| In the text | |
|
Fig. 11. Location of zC-400569 (red dots) and zC-488879 (orange stars) on the radial acceleration relation at z ≃ 0 (blue colorscale and open squares). For both galaxies we assume the values of Υgas, Υdisk, and Υbul from the baryons-only mass model (Sect. 5.3). Both galaxies lie on the 1:1 relation (dotted line) at high accelerations, similarly to disk galaxies at z ≃ 0. To unambiguously probe the DM effect (gobs > gbar) one needs more extended rotation curves probing lower accelerations. |
| In the text | |
|
Fig. A.1. Same as Figure 6 but for the CO(3 − 2) cube (top panels) and CO(4 − 3) cube (bottom panels) of zC-400569. |
| In the text | |
|
Fig. A.2. Same as Figure 6 but for the CO(3 − 2) cube (top panels) and CO(4 − 3) cube (bottom panels) of zC-299568. |
| In the text | |
|
Fig. B.1. Corner plots for different mass models of zC-400569 (see Sect. 5): baryons only (top left), MOND (top right), and baryons plus a NFW halo (bottom). The various panels show the posterior probability distribution of pairs of fitting parameters, and the marginalized probability distribution of each fitting parameter. In the inner panels, individual MCMC samples outside the 2σ confidence region are shown with black dots, while binned MCMC samples inside the 2σ confidence region are shown by a grayscale; black contours correspond to the 1σ and 2σ confidence regions; the red squares and solid lines show median values. In the outer panels (histograms), solid and dashed lines correspond to the median and ±1σ values, respectively. |
| In the text | |
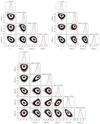 |
Fig. B.2. Same as Fig. B.1 but for zC-488879. |
| In the text | |
Current usage metrics show cumulative count of Article Views (full-text article views including HTML views, PDF and ePub downloads, according to the available data) and Abstracts Views on Vision4Press platform.
Data correspond to usage on the plateform after 2015. The current usage metrics is available 48-96 hours after online publication and is updated daily on week days.
Initial download of the metrics may take a while.