Fig. 9.
Download original image
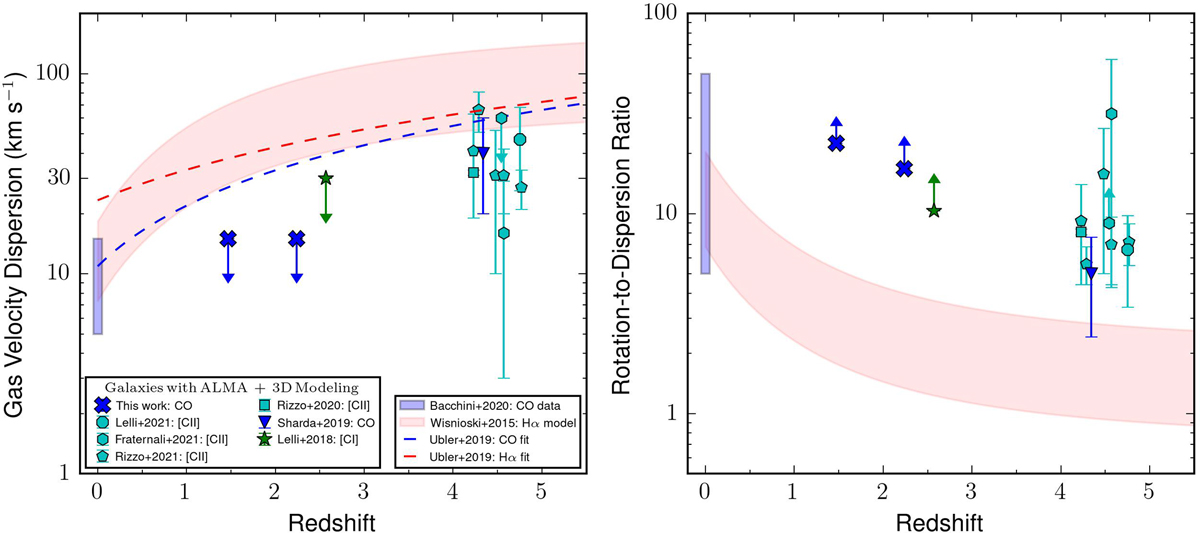
Gas velocity dispersion (left panel) and Vrot/σV ratio (right panel) as a function of redshift. The pink band shows the model from Wisnioski et al. (2015) based on the Toomre-disk instability criterion. The dashed lines show the best-fit functions from Übler et al. (2019) using IFU data of ionized gas (red) and NOEMA data of molecular gas (blue). The points show individual galaxies that satisfy two quality criteria: (1) ALMA observations of cold gas tracers such as CO (blue points), [C I] (green), and [C II] (cyan) lines, and (2) detailed kinematic modeling with 3DBAROLO.
Current usage metrics show cumulative count of Article Views (full-text article views including HTML views, PDF and ePub downloads, according to the available data) and Abstracts Views on Vision4Press platform.
Data correspond to usage on the plateform after 2015. The current usage metrics is available 48-96 hours after online publication and is updated daily on week days.
Initial download of the metrics may take a while.