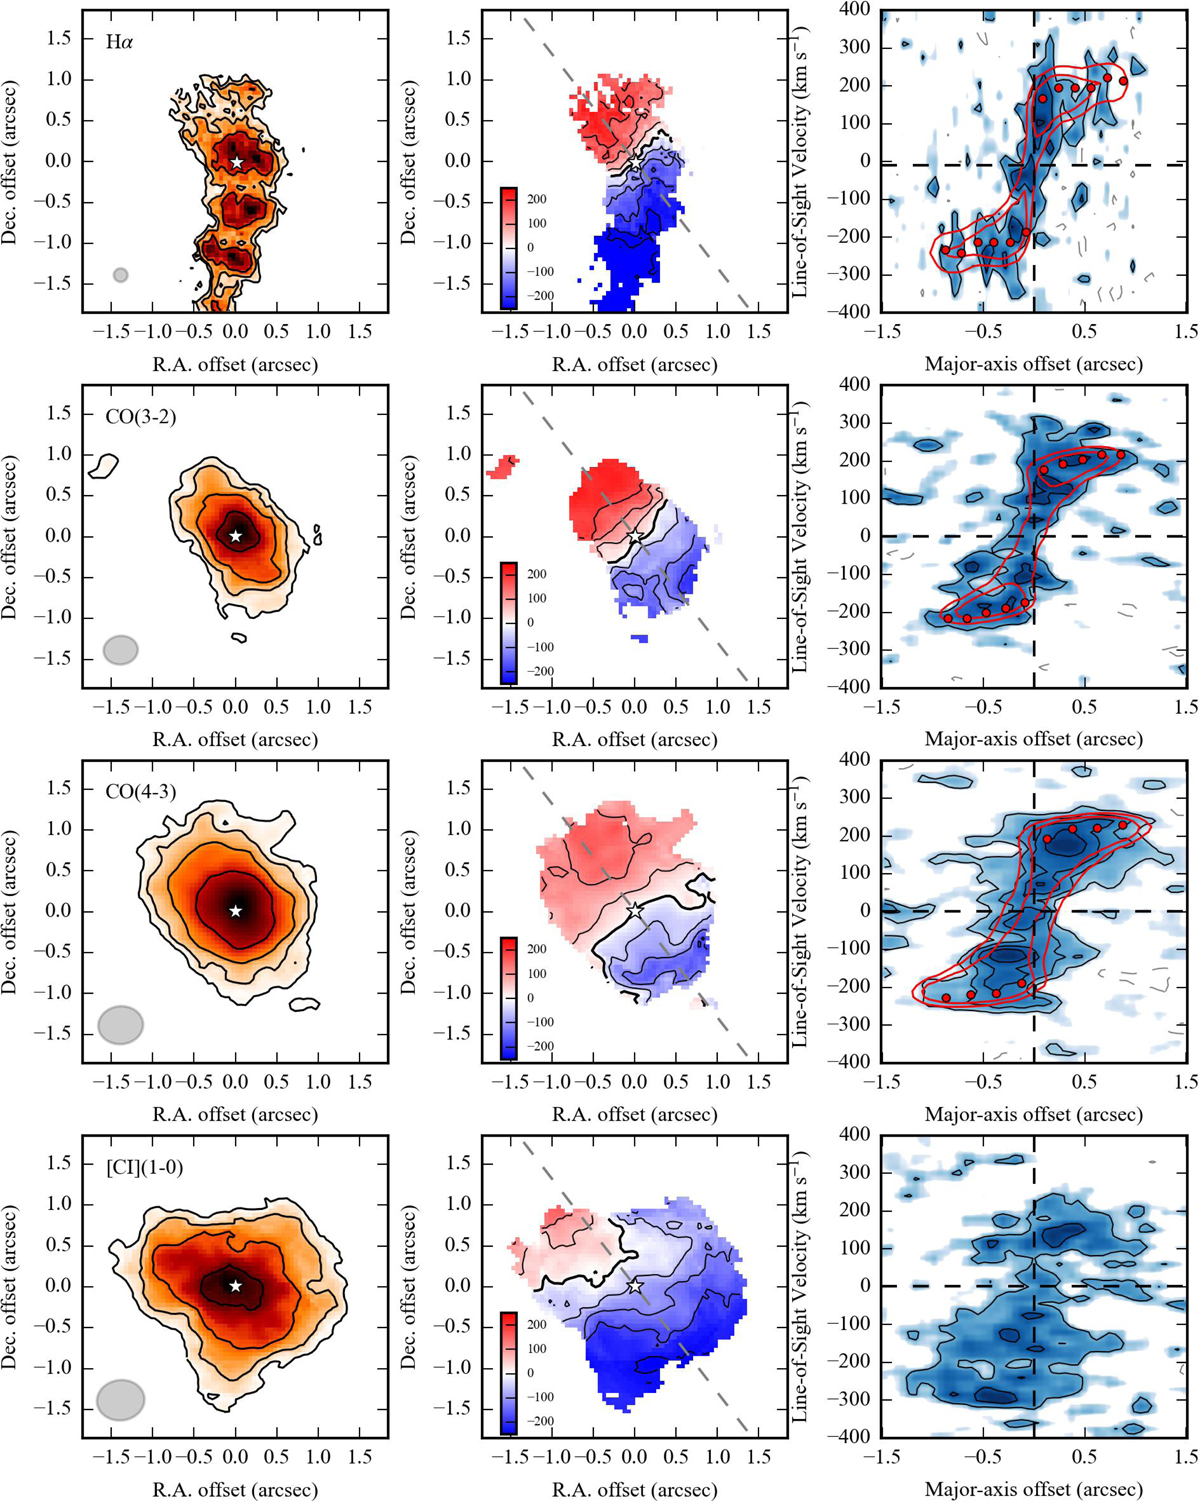
Fig. 4.
Download original image
Overview of zC-400569 at z ≃ 2.24. Left panels: total intensity maps for different emission lines, indicated in the top-left corner. Contours are at (3, 6, 12, 24) σmap with the 3σmap values given in Table 1. The white star shows the kinematic center. The gray ellipse to the bottom-left corner represents the PSF. Middle panels: velocity fields. The thick contour corresponds to the systematic velocity (set to zero) and the thin contours are in steps of ±60 km s−1. The white star shows the kinematic center and the dashed line shows the disk major axis. Right panels: position-velocity diagrams along the disk major axis. The blue colorscale shows the observed gas emission. Black contours range from 2σcube to 8σcube in steps of 2σcube. Red contour (at 2σcube and 4σcube) shows the best-fit 3D kinematic model from 3DBAROLO. The red dots show the best-fit sky-projected rotation curve. The vertical and horizontal dashed lines correspond to the galaxy center and systemic velocity, respectively.
Current usage metrics show cumulative count of Article Views (full-text article views including HTML views, PDF and ePub downloads, according to the available data) and Abstracts Views on Vision4Press platform.
Data correspond to usage on the plateform after 2015. The current usage metrics is available 48-96 hours after online publication and is updated daily on week days.
Initial download of the metrics may take a while.