Fig. 1.
Download original image
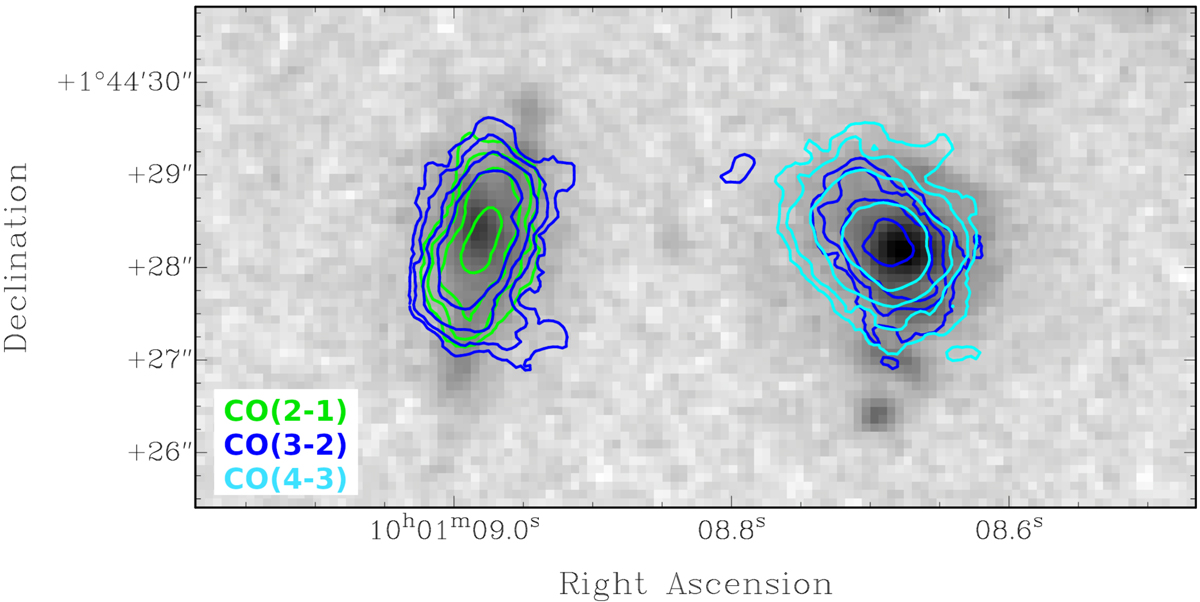
Galaxies zC-488879 at z ≃ 1.47 (left) and zC-400569 at z ≃ 2.24 (right). The HST/WFC3 image in the NIR F160W filter (gray scale) is overlaid with CO(2 − 1) emission (green contours), CO(3 − 2) emission (blue contours), and CO(4 − 3) emission (cyan contours). Contours are at (3, 6, 12, 24) σmap with the values of 3σmap given in Table 1. The band 4 observations have lower quality than the band 3 ones, so the different spatial extent of CO(3 − 2) and CO(4 − 3) emission in zC-400569 may be due to sensitivity rather than being physical.
Current usage metrics show cumulative count of Article Views (full-text article views including HTML views, PDF and ePub downloads, according to the available data) and Abstracts Views on Vision4Press platform.
Data correspond to usage on the plateform after 2015. The current usage metrics is available 48-96 hours after online publication and is updated daily on week days.
Initial download of the metrics may take a while.