| Issue |
A&A
Volume 663, July 2022
|
|
|---|---|---|
| Article Number | A78 | |
| Number of page(s) | 11 | |
| Section | Cosmology (including clusters of galaxies) | |
| DOI | https://doi.org/10.1051/0004-6361/202243418 | |
| Published online | 14 July 2022 | |
The dynamical state of RXCJ1230.7+3439: A multi-substructured merging galaxy cluster
1
Instituto de Astrofísica de Canarias, C/Vía Láctea s/n, 38205 La Laguna, Tenerife, Spain
e-mail: This email address is being protected from spambots. You need JavaScript enabled to view it.
2
Universidad de La Laguna, Departamento de Astrofísica, 38206 La Laguna, Tenerife, Spain
3
Max-Planck-Institut für extraterrestrische Physik, 85748 Garching, Germany
4
Universitäts-Sternwarte München, Fakultät für Physik, Ludwig-Maximilian-Universität München, Scheinerstr. 1, 81679 München, Germany
Received:
24
February
2022
Accepted:
11
May
2022
Abstract
We analyse the kinematical and dynamical state of the galaxy cluster RXCJ1230.7+3439 (RXCJ1230), at z = 0.332 using 93 new spectroscopic redshifts of galaxies acquired at the Telescopio Nazionale Galileo and from SDSS DR16 public data. We study the density galaxy distribution retrieved from photometric SDSS multiband data and find that RXCJ1230 appears as a clearly isolated peak in the redshift space, with a global line-of-sight (LOS) velocity dispersion of σv = 1004−122+147 km s−1. Several tests applied to the spatial and velocity distributions reveal that RXCJ1230 is a complex system with the presence of three subclusters, located to the southwest, east, and south with respect to the main body of the cluster, containing several bright galaxies (BGs) in their respective cores. Our analyses confirm that the three substructures are in a pre-merger phase, where the main interaction takes place with the southwest subclump, almost in the plane of the sky. We compute a velocity dispersion of σv ∼ 1000 and σv ∼ 800 km s−1 for the main cluster and the southwest substructure, respectively. The central main body and southwest substructure differ by ∼870 km s−1 in the LOS velocity. From these data, we estimate a dynamical mass of M200 = 9.0 ± 1.5 × 10¹⁴ M⊙ and 4.4 ± 3.3 × 10¹⁴ M⊙ for the RXCJ1230 main body and southwest clump, respectively, which reveals that the cluster will undergo a merger characterised by a 2:1 mass ratio impact. We solve a two-body problem for this interaction and find that the most likely solution suggests that the merging axis lies ∼17° from the plane of the sky and the subcluster will fully interact in ∼0.3 Gyr. However, a slight excess in the X-ray temperature observed in the southwest clump confirms a certain degree of interaction already. The comparison between the dynamical masses and those derived from X-ray data reveals good agreement within errors (differences ∼15%), which suggests that the innermost regions (< r500) of the galaxy clumps are almost in hydrostatical equilibrium. In summary, RXCJ1230 is a young but also massive cluster in a pre-merging phase accreting other galaxy systems from its environment.
Key words: galaxies: clusters: individual: RXCJ1230.7+3439 / X-rays: galaxies: clusters
© R. Barrena et al. 2022
 Open Access article, published by EDP Sciences, under the terms of the Creative Commons Attribution License (https://creativecommons.org/licenses/by/4.0), which permits unrestricted use, distribution, and reproduction in any medium, provided the original work is properly cited.
This article is published in open access under the Subscribe-to-Open model. This email address is being protected from spambots. You need JavaScript enabled to view it. to support open access publication.
1. Introduction
According to the hierarchical structure formation scenario, galaxy clusters (GCs) are the youngest bound systems in our Universe. The cold dark matter model together with the theory of cosmic inflation predicts the initial conditions for the structure formation (see e.g. Springel 2005), where clusters form in the deepest potential wells generated by the dark matter (DM) overdensities. GCs contain multiple components. In addition to DM, haloes include baryonic matter in different forms (see e.g. Allen et al. 2011). Cold and hot gas and non-thermal plasma constitute the intra-cluster medium (ICM), which highly reacts in collision processes, while the galactic component is less affected in merger events. This multi-component nature allows us to analyse GCs through different wavelengths, given that different physical processes take place in each case. For example, we use X-rays and radio observations to probe the ICM (Loewenstein 2003; Böhringer & Werner 2010; van Weeren et al. 2019), while visible and infrared (IR) data are used to analyse the galactic behaviour (see Biviano 2000, for a review). On the other hand, DM is better studied through weak-lensing techniques (Umetsu 2000), therefore the multi-wavelength observations provide a more complete view of the reality of GCs.
X-ray observations are often used to investigate the dynamical state of GCs. However, optical information is essential for studying the dynamics of cluster mergers (Golovich et al. 2019). The spatial distribution (obtained from photometric observations) and kinematics (retrieved using spectroscopic redshifts) of galaxy members allow us to identify substructures and to analyse possible pre- and post-merging scenarios. Moreover, optical data complement the X-ray information because ICM and galaxies react on different timescales during a collision (Roettiger et al. 1997), hence the importance of combining X-ray and optical data. In this context, we analyse in this work the dynamical state of the RXCJ1230.7+3439 (hereafter RXCJ1230) cluster of galaxies using X-ray and optical data.
RXCJ1230 was discovered using X-ray data by Appenzeller et al. (1998) under the designation ATZ98-D219 and by Böhringer et al. (2000) as part of the NORAS survey, with a redshift of z = 0.333. This cluster was also detected through its Sunyaev-Zeldovich (SZ) signal in the second Planck cluster catalogue (Planck Collaboration XXVII 2016). It was also detected in the Northern Sky Cluster Survey (Gal et al. 2003) and in the Sloan Digital Sky Survey (SDSS) by Wen et al. (2009) and Hao et al. (2010). RXCJ1230 contains a strong X-ray point source in the north of the cluster associated with the NVSS 123050+344257 radio galaxy, at the redshift of the cluster.
To date, there is little spectroscopic information on RXCJ1230 available in the literature and databases. For instance, only 15 spectroscopic redshifts are reported by SDSS-DR16 within a region of 15′ radius with respect to the centre of the cluster, which is insufficient to perform any detailed dynamical study. We therefore recently carried out multiobject spectroscopic observations at the TNG 3.5m telescope, obtaining new redshift data for 81 galaxies in the field of RXCJ1230. In addition, we also include photometric information retrieved from SDSS-DR16 and Pan-STARRS1 imaging archives. These data, together with X-ray information, will allow us to investigate the kinematics and dynamics of RXCJ1230, obtaining satisfactory answers for questions such as whether or not this is a merging cluster, whether it is in a pre- or a post-merger phase, and how well X-ray and dynamic mass estimates match. Here, we clarify the dynamical stage of RXCJ1230.
This paper is organised as follows. We describe the new spectroscopic observations and data samples in Sect. 2. In Sect. 3 we present our results about the selection of galaxy members, velocity and spatial distributions, and substructures. In Sect. 4, we present global properties, dynamical masses of the different structures, and a comparison with X-ray properties. In Sect. 5, we analyse the 3D dynamics of the complex and propose a plausible pre-merging scenario for RXCJ1230. At the end of this paper, in Sect. 6, we summarise our results and present our conclusions.
In this paper, we assume a flat cosmology with Ωm = 0.3, ΩΛ = 0.7 and H0 = 70 h70 km s−1 Kpc−1. Under this cosmology, 1 arcmin corresponds to 287  Mpc at the redshift of the cluster.
2. Data sample
2.1. Optical spectroscopy
We performed multi-object spectroscopic (MOS) observations of RXCJ1230 at the 3.5m TNG telescope in 2020 March, mapping a region of about 10′ × 10′ with two MOS masks and including a total of 92 slits. We used the DOLORES spectrograph and the LR-B grism1, which offers a wavelength coverage of between 370 and 800 nm with a spectral resolution of 2.75 Å per pixel. The total integration time was 3600 s per mask, divided into two exposures of 1800 s each. The combination of these two acquisitions allowed us to correct the spectra for cosmic rays.
The spectra were extracted using standard IRAF packages. The radial velocity computation was performed using the cross-correlation technique developed by Tonry & Davis (1979) and implemented as the task RVSAO.XCSAO in IRAF environment. This procedure correlates the features detected in the observed spectra (mainly Ca H and K doublet, Hδ, G band, MgI, in absorption and the most relevant emission lines such as OII, OIII doublet, Hα, Hβ and Hδ) with that present in the templates spectra. We used five different reference spectra of the Kennicutt Spectrophotometric Atlas of Galaxies (Kennicutt 1992), for five different morphologies (Elliptical, Sa, Sb, Sc and Irr types). This procedure yields radial velocity estimates and the corresponding errors due to the correlation technique applied. After rejecting the spectra with lower signal-to-noise ratio (S/N), we obtained 81 spectroscopic redshifts. In addition, we also consider 12 redshifts retrieved from the SDSS DR16 spectroscopic database present in the region sampled by the two-mask field of view around RXCJ1230.
A detailed comparison between redshifts derived from multiple measures of the same target (obtained from two different estimations in the two masks, or even between SDSS redshift and our estimate), we see that the nominal velocity errors provided by the cross-correlation technique are too small. Therefore, in order to convert this error into a realistic value, considering systematic errors, we need to multiply it by a factor of 2 (see e.g. Boschin et al. 2013).
Table 1 lists the full spectroscopic sample considered in this work (see also Fig. 1). Col. 1 lists an ID number (cluster members are indicated), Cols. 2 and 3 report the equatorial coordinates of galaxies in the J2000 system, Col. 4 the heliocentric radial velocity (v = cz) with errors (Δv), and Cols 5 and 6, the complementary photometric information (r′ and i′ dered magnitudes) retrieved from SDSS DR16. The last column includes some comments regarding particular features of some galaxies.
Velocity catalogue of 93 galaxies measured spectroscopically in the RXJ1230 field.
 |
Fig. 1. Left panel: RGB colour composite image obtained by combining g′-, r′-, and i′-band images of 13′ × 10′ field of view from Pan-Starrs1 public archive. Circles and squares correspond to galaxy members and non-members, respectively, obtained from our spectroscopic observations and SDSS-DR16 spectroscopic database. Superimposed, we also show the contour levels of isodensity galaxy distribution of likely members (see Sect. 3.3). Right panel: same RGB image but overplotting the contour levels of the XMM-Newton image corresponding to the observation ID 0841900101. The X-ray contours were obtained after smoothing the original image using a Gaussian filter with σ = 6 arcsec. Point sources and emission from NVSS 123050+344257 radio galaxy (ID 78) have been removed, masking them with circular apertures of 10–20 pixels radius. In both panels, the BCG and BGs are also marked. North is up and east is left. |
Our spectroscopic catalogue includes a total of 93 galaxy redshifts in a region of 9′ × 10′ arcmin (see Fig. 1, left panel). The MOS mask design was initially planned to cover the densest galaxy regions more efficiently. The majority of the spectroscopic redshifts therefore follow an elongated region in the NE–SW direction. Our full redshift sample presents a median S/N and cz error of 8 and 82 km s−1, respectively. We detect 12 star forming galaxies characterised by the presence of the [OII] emission line.
2.2. Optical photometry
We complement our redshift sample with photometric information retrieved from the SDSS DR16 database. We consider deredr′ and i′ magnitudes2. Galaxy counts in this region reveal the photometric SDSS sample is ∼90% complete for galaxies down to a magnitude of r′ = 21.5, which is in agreement with the mean SDSS DR12 depth estimations3. Comparing the spectroscopic and photometric samples in the area covered by MOS masks, we find that the completeness of the spectroscopic sample is ∼55% for galaxies down to magnitude r′ = 21. However, we are able to obtain redshifts even for galaxies with r′> 21.5. On the other hand, Pan-STARRS1 data archive4 was only used in order to retrieve RGB images and overplot density contours and galaxies with spectroscopic redshifts (see Fig. 1).
2.3. Complementary X-ray data
The XMM-Newton observations (ID 0841900101) and their data analysis, which complete our multi-wavelength study, are described in detail in Böhringer et al. (2022). Here, we only use X-ray data for a qualitative and morphological analysis. We use the 0.5 to 2.0 keV band, which provides the highest S/N above the background. In the present work we perform two minor modifications to the raw X-ray image. Firstly, we remove the point sources and emission from the NVSS 123050+344257 radio galaxy (ID 78) by masking them with circular apertures of 10–20 pixels radius. Secondly, we smooth the original image using a Gaussian filter with a FWHM = 12 arcsec. After this process, we obtain the X-ray surface brightness maps plotted as contours in the right panel of Fig. 1, overlaid to an optical colour composite image from the PanSTARSS survey (similarly as shown in Fig. 2 by Böhringer et al. 2022).
Analysis of the X-ray spectra in the different substructures of the cluster yields an intracluster plasma temperature of 4.7 ± 0.4 keV for the central main component, 4.4 ± 0.6 keV for the southwestern subcluster, and  keV for the eastern structure (Böhringer et al. 2022). These authors also find that the temperature profile for the main component is not very steep, with a polytropic index of between isothermal and 1.2, and none of the components have a cool core. From the temperature and the shape of the intracluster gas distribution, Böhringer et al. (2022) obtained a hydrostatic mass estimate of the cluster components. They combined this result with mass estimates based on scaling relations of cluster mass with X-ray temperature, X-ray luminosity, total gas mass, and YX (the product of temperature and gas mass) to arrive at a consistent picture for the mass estimation; see Sect. 4.1 for a summary of X-ray mass and a comparison with the dynamical one.
3. Analysis and results
3.1. Member selection and global properties
To minimise the presence of interlopers, we applied a 2.7σv clipping in the cz coordinate, taking into account the radial profile of the expected velocity dispersion (Mamon et al. 2010). To this end, we applied an iterative method whereby, in a first step, we find the mean significant peak in the velocity distribution (v0 = ⟨cz0⟩) and estimate first velocity dispersion (σ0 = σv, 0) using the rms estimator. Considering these two values, in a second step, we select cluster members as galaxies with v < v0 ± 2.7σ0. In the final step, we refine the estimation of the mean cz of the cluster and re-evaluate the velocity dispersion σv of the cluster. This simple three-step procedure yields stable and converging values of v̄ and σv in a fourth and subsequent step. Figure 2 shows the redshift distribution of the galaxies listed in Table 1.
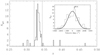 |
Fig. 2. Galaxy redshift distribution. Dashed vertical lines delimit the redshift range including 77 galaxy members assigned to RXCJ1230 according to 2.7σv clipping. The velocity distribution in the cluster rest frame of the 77 cluster members selected is superimposed. The black curve represents the reconstruction of the velocity distribution as a Gaussian profile, considering the σv computed using the biweight estimator and assuming all the galaxies belong to a single system. The velocity corresponding to the BCG is also marked. |
To select cluster members out of the 93 galaxies in our spectroscopic sample, we followed a method based on the galaxy position in the 2D projected phase space (r, cz), where r is the projected distance from the cluster centre, and cz is the galaxy line-of-sight velocity (see Fig. 3, top panel).
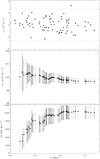 |
Fig. 3. Top panel: rest frame velocity versus projected distance to the cluster centre for the 77 galaxy members selected. The cluster centre is assumed to be the position of the BCG. Middle and bottom panels: integral profiles and LOS velocity dispersion, respectively. These values are computed by considering all galaxies within that radius. The first value computed is estimated from the first five galaxies closest to the centre. The error bars are at the 68% c.l. |
In this way, we select 77 galaxy members with a v̄ = 99658 ± 161 km s−1 (z = 0.3324) with an rms of 969 ± 130 km s−1 (errors at 95% confidence leve [c.l.]) in the cluster rest frame. In order to verify these values, we also apply the bi-weight scale estimator (Beers et al. 1990) considering the 77 redshifts. We find  km s−1. Thus, both rms and bi-weight estimators produce results in perfect agreement within errors. However, in order to check how robust this estimate is, we study the variation of σv with the distance to the centre of the cluster, which is taken to be the brightest cluster galaxy BCG) position. The bottom panel of Fig. 3 shows that the integral σv profile is flat beyond 0.7 Mpc, suggesting that the estimation of the σv is robust for the whole cluster. In the following analyses, we use the bi-weight estimator given its robustness in cases where the statistics clearly departs from the Gaussian distribution. In addition to the 77 members, we detect 6 galaxies in the foreground and 10 in the background of RXCJ1230.
We note that the BCG is not strictly the brightest galaxy of this complex cluster. The BCG is the brightest galaxy in the main body and the most massive clump of galaxies, and lies very close to the X-ray peak emission and the maximum of galaxy isodensity distribution (see Fig. 1). There are another four galaxy members even brighter than the BCG in RXCJ1230 (see Table 1 and Figs. 1 and 4) lying in the surrounding subclusters. These four bright galaxies are labelled as BGs in order to differentiate them from the actual BCG. These four galaxies can also probably be considered as BCGs of their respective subclusters, but we label them as BGs to keep the notation clear.
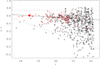 |
Fig. 4. Colour–magnitude diagram (r′−i′,r′) of galaxies in a region of 12.4′ × 9.6′. Red symbols correspond to galaxy members confirmed spectroscopically (red dot corresponds to the BCG of the cluster). The solid line represents the red sequence defined as the densest locus in this diagram, which follows the linear fit r′−i′ = − 0.028 * r′+1.118. Dashed lines delimit the region that encloses the RS and the blue cloud in this diagram. Galaxies included in this region are considered likely members, which are used to obtain the isodensity galaxy distribution shown in Fig. 1. |
Another remarkable effect that we find is a clear dependence of the mean velocity on the clustercentric distance (see Fig. 3, middle panel). We notice that the inner region shows higher mean velocity, while regions surrounding the main body exhibit velocities of up to 500 km s−1 lower.
The BCG of RXCJ1230 (the ID 60) presents a velocity of 100 064 ± 28 km s−1, which is about 310 km s−1 higher than the mean velocity of the cluster. In addition to the BCG, with magnitude r′ = 18.49, we also detect two even brighter galaxies (IDs 22 and 21, with r′ = 17.90 and 18.07) located to the southwest. In addition to these bright galaxies (BGs), we identify two very bright galaxies showing BCG features. One of them is located to the south (the ID 61, with r′ = 18.69), and the other to the east (the ID 93, with r′ = 18.13). As Fig. 1 shows, the BCG and all BGs are very close to the X-ray peaks as recovered from XMM-Newton data. The BCG is coincident with the main (and central) body of the cluster, while the BG-W(1) and BG-W(2) are very close to the southwest X-ray peak. In a similar way, the BG-S is almost coincident with a small elongation of the X-ray surface brightness towards the south, and the BG-E is placed in the maximum of a weak X-ray emission located to the east of the cluster. As we discuss in following sections, each one of these BGs is linked to a corresponding substructure, configuring a complex multi-substructure cluster.
In addition to this set of BGs, we detect 12 galaxies showing [OII] emission lines, but only 4 of these galaxies are cluster members. The S/N and the spectral resolution of our data allow us to detect [OII] lines with equivalent widths > 8 Å. These emission line galaxies (ELGs; star-forming galaxies) are the IDs 5, 62, 80, and 84, and show [OII] equivalent widths of 15, 95, 12, and 18 Å, respectively. The ELG members represent 5.2% of the cluster members in our sample. This fraction indicates that the star-forming processes have been quenched in RXCJ1230, which is in agreement with the presence of high-galaxy-density environments with ICM showing high TX (Laganá et al. 2008).
3.2. Velocity field
Deviation from Gaussianity in the radial velocity distributions is a clear indicator that clusters present substructures (see e.g. Ribeiro et al. 2011). In order to check whether the velocity distribution of RXCJ1230 follows a Gaussian shape, we use two profile estimators, the skewness and kurtosis indexes. Positive skewness indicates the distribution is skewed to the right, with a longer tail to the right of the distribution maximum, while negative skewness indicates that the distribution is shifted and tailed to the left. On the other hand, positive values of the kurtosis indicate distributions presenting thinner tails (leptokurtic) than the normal distribution, while negative values indicate distributions with fatter tails (platykurtic). In our case, we obtain −0.038 and −0.532 for the skewness and kurtosis, respectively. These values suggest that the velocity distribution follows a slightly flatter shape than a normal one, and is quite symmetric. This implies that most of the substructures are probably placed close to the plane of the sky and no significant velocity deviations are expected in the radial component (along the line of sight).
3.3. Two-dimensional galaxy distribution
Given that our spectroscopic sample suffers from magnitude incompleteness and does not map the whole cluster field, we also adopt the photometric SDSS DR16 catalogues. Using the r′ and i′ SDSS DR16 photometry in a region of 12.4′ × 9.6′, we construct a (r′−i′ vs. r′) colour–magnitude diagram (CMD; see Fig. 4) and select likely members from there. First, we fit a red sequence (RS) to the spectroscopicaly confirmed members by fixing the slope to −0.028 following the prescription detailed in Barrena et al. (2012). We obtain r′−i′ = − 0.028 × r′+1.118(±0.05). Then, in order to select both likely early-type members (placed in the RS) and galaxy members residing in the green valley and blue cloud (below the RS) in the CMD of the cluster (Eales et al. 2018), we select the locus defined by the RS ± 3 × rms as upper limit and −0.1615 × r′+3.37 as lower limit in r′−i′, respectively. In addition, we select galaxies down to r′ = 22.2. This locus in the CMD selects 618 likely galaxy members (dashed lines in Fig. 4) in the region considered.
The left panel of Fig. 1 shows the contour levels of the isodensity galaxy distribution of likely members. This map was obtained by evaluating the cumulative contribution of 618 Gaussian profiles (with σ = 1 arcsec width) centred on each individual member in a grid of 245 × 200 points. From this study we can assess that the cluster presents a central high-density clump (the main body) and the BCG (ID 60) coincident with the highest density peak. A secondary and very dense clump is seen towards the southwest and two very bright galaxies (IDs 22 and 21) are positioned very close to the corresponding peak of that clump. The isodensity contours show a clear elongation from the main body of the cluster to the south. This concentration of galaxies shapes a third small substructure towards the south also containing a BG (ID 61). Finally, a fourth galaxy clump that is not as clear in the isodensity contours but also contains a BG (ID 93) is located eastward. Thus, we detect three galaxy clumps (towards the southwest, south, and east, respectively, and following the order of a decreasing density) surrounding a very dense main cluster. Table 2 lists the precise positions and global properties for these four significant galaxy clumps.
Positions and global properties of the whole cluster and the four galaxy clumps detected in RXCJ1230.
We note that the external regions of RXCJ1230 are particularly rich in substructures. The substructure configuration reported here using optical data, which is characterised by a central main body with three substructures around it, completely agrees with that observed and reported by Böhringer et al. (2022) using X-ray data retrieved by XMM-Newton. As Fig. 1 shows, the galaxy density contours (left panel) and X-ray surface brightness profile (right panel) are almost coincident and follow the same shape.
3.4. Spatial–velocity correlations
One of the most useful tools for verifying the existence of substructures is the study of spatial–velocity correlations. In this work, we use different techniques to analyse the structure of RXCJ1230 combining positions and velocities of galaxy members.
The presence of internal structures clearly influences the cluster velocity field. Therefore, in a first step, in order to investigate the RXCJ1230 complex, we divide galaxies into two samples. We search for possible bimodality through the presence of gaps in the velocity distribution, which could cause drops in the galaxy counts for some particular bins of the velocity histogram (see e.g. Fig. 4 in Barrena et al. 2007 for a clear bimodal configuration of Abell 773). In our case, the most important drop is that detected around −500 km s−1 (see Fig. 2, inner panel). Considering this drop of galaxy counts around −500 km s−1 as a possible frontier between two separate galaxy subsamples, we study the spatial distribution of galaxies with v < −500 km s−1 and v ≥ −500 km s−1, respectively. We detect no differences between these two galaxy subsets and both populations are homogeneously distributed in space, which suggests that this drop in the velocity histogram is not representative of individual galaxy clumps.
In a second approach, we again divide the galaxy velocity sample into two sets: one containing low velocities with v < v̄, and a second subset with high velocities (v > v̄). In other words, the low- and high-velocity subsamples correspond to galaxies with negative and positive velocities with respect to the mean velocity in the cluster velocity rest frame (see inner panel of Fig. 2). We check the difference between the two distributions of galaxy positions. Figure 5 shows that low- and high-velocity galaxies are segregated, as we advance in Sect. 3.1. While high-velocity galaxies (red contours) shape the main body of the system, the low-velocity galaxies (blue contours) are placed in the three surrounding substructures. This can also be seen in Fig. 3 (middle panel), where ⟨v⟩ takes values of about 100 200 km s−1 for distances ∼0.3−0.4 Mpc and 99 700 km s−1 at > 1.2 Mpc.
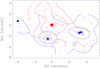 |
Fig. 5. Isodensity contours of spectroscopically confirmed galaxy members. Blue contours corresponds to the 2D distribution of galaxies with negative velocity with respect to the mean velocity in the cluster rest frame (see Fig. 2, inner panel). Similarly, red contours show isodensity levels for galaxies with positive velocity with respect to the mean cluster velocity. This plot is centred on the BCG marked with a large big dot. Blue dots correspond to BGs belonging to the corresponding clumps. Red and blue contours are plotted at the same density level. |
We carry out a second test for checking this spatial–velocity segregation. We combine galaxy velocities and positions by computing the δ-statistics using the Dressler & Schectman (DS) test (Dressler & Shectman 1988), which looks for groups of galaxies showing deviations from the local velocity mean, or with velocity dispersion that differs from the global one. If one assumes a random distribution of velocities, one would expect such deviations to be proportional to the number of galaxy members, Δ ∼ N, for clusters without substructure or clusters with substructures with similar velocity dispersion and relative movement in the line of sight with respect to their main body. On the other hand, one would expect Δ > N for clusters with substructures showing relative movements in the line of sight well differentiated from the main body, and/or even subclusters with lower velocity dispersion with respect to the main cluster. We find a cumulative deviation of Δ = 65 (at the 95% c.l., as estimated by computing 1000 Monte Carlo simulations), which is a value comparable to the number of members (77). This suggests that all of the substructures of RXCJ1230 move with no significant deviation in the line of sight component with respect to the main cluster body, which is in agreement with the finding we present in Sect. 3.2. In addition, the Δ value shows that no group has been detected that has a velocity dispersion that is very different from that of the whole cluster. However, the cumulative Δ is unable to provide information on the presence of possible individual galaxy clumps. This issue is explored in the following using the individual δ associated to each galaxy position and also obtained through the DS test.
Figure 6 illustrates the δ-statistics combined with the spatial distribution of the 77 cluster members. A square is plotted around each point of size proportional to exp(δi). Therefore, the larger the square, the larger the deviation (δ) of the local mean velocity from the global mean. Red squares correspond to galaxies with  (where
  is the mean δi deviation of the 77 cluster members), while blue represents members with deviations
  . This plot shows that the most important substructures are mainly located east and southwest of the main body of the cluster. The galaxies of these groups present higher deviations than galaxies in the main body (centre). The main advantage of this method is that no a priori selections or assumptions about the positions of subclumps have to be imposed. Therefore, this finding is more parameter-independent and thus more robust.
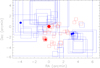 |
Fig. 6. Spatial distribution of the 77 cluster members, each marked by a square. The sizes of the squares are proportional to exp(δi), which is computed using the δi deviations obtained in the DS test. Red and blue squares separate populations showing deviations lower and higher than |

In summary, the study of the individual δ of the DS test provides us with valuable proof of the presence of substructures in the periphery of the cluster confirmed by high deviations from the mean velocity of the cluster in the external zones. This finding is in agreement with what we find in the 2D spatial distribution (see Sect. 3.3). In addition, the cumulative Δ is comparable to the number of cluster members, which suggests that no large relative movement of these substructures is expected in the radial component. Therefore, in agreement with what we find in Sect. 3.2, relative movements of subclusters with respect to the main body should be (almost) contained in the plane of the sky.
With the aim of identifying individual galaxies belonging to each substructure, we use a new 3D diagnostic test. We apply a 3D version of the Key Mixture Model (KMM; Ashman et al. 1994) algorithm in order to separate different components in velocity space. The KMM algorithm estimates the probability that a given galaxy belongs to a given component in an iterative procedure. The output from the algorithm is a list of galaxies associated with the cluster main body and with each additional substructure. However, it needs to start from an initial input configuration. In order to minimise the dependence of the final results of probabilities on the initial guess input, we run KMM with several (more than ten) initial random allocations to three galaxy populations composed of 25, 25, and 24 galaxies (the three easternmost galaxies have been excluded from this test given the redshift undersampling in this region5). The final result was always the same, converging into a very stable solution. The output set of probabilities always fits a three-group partition, assigning 9 and 7 galaxies to the southwestern and southern substructures, respectively, with > 95% probabilities according to the likelihood ratios obtained from KMM test. The remaining galaxies are assigned to the main cluster body. This galaxy allocation, for the main body and the two (southwestern and southern) substructures is shown in Fig. 7. On the other hand, the analysis of the p-value probability of obtaining this KMM result by chance is lower than 0.001 (< 0.1% probability). The substructure to the east was not identified through this technique mainly due to the lack of redshift information in this zone. However, the DS test shows high δi deviations in the surroundings of this region, around the (−3′,1′) position in Fig. 6.
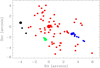 |
Fig. 7. Spatial distribution on the sky of the 77 cluster members. The 9 blue and 7 green dots correspond to the galaxies belonging to the southwestern and southern substructures identified with > 95% probability using the KMM procedure. Red dots correspond to galaxy members that are part of the cluster main body with different probabilities following the same algorithm. Black dots correspond to galaxies selected manually as part of the eastern clump according to their space–velocity segregation (see Fig. 5). Large dots mark the BCG and BGs. |
4. Dynamical mass of RXCJ1230
On the basis of the results presented in the previous section, we can conclude that RXCJ1230 is composed of three substructures, which are spatially well separated in the sky. The main substructure is placed to the southwest with respect to the main body of the cluster, and contains two very bright galaxies, the BGs-W (1 and 2). A second substructure is located toward the south, which resembles a very compact group of galaxies dominated by a very bright galaxy, the BG-S. In addition, the spatial distribution of galaxies and the X-ray surface brightness map suggest the presence of a third clump located to the east and containing a BG.
Although RXCJ1230 is in a phase of interaction, the main system and the three surrounding substructures are still well separated and the 2D galaxy density distribution and BGs closely match their corresponding X-ray peaks. We can therefore assume that RXCJ1230 is in a pre-merging phase. Moreover, no shock fronts are detected in the X-ray surface brightness map, which are very commonly formed after collisions. It is therefore reasonable to assume that each substructure has not yet collided and is roughly in dynamical equilibrium, which allows us to compute virial quantities and estimate the mass of the whole cluster as the sum of the individual subclump masses.
Table 2 lists the kinematical properties of this complex, which is composed of a main central cluster surrounded by three substructures. Following the KMM test, we unequivocally associate 9 and 7 galaxies to the southwestern and southern substructures (see Fig. 7). This allows us to estimate a mean velocity and a rough velocity dispersion for these substructures: we obtain v̄SW = 98 810 ± 126 and v̄ S = 99 090 ± 192 km s−1 for the mean velocity of the substructures to the SW and S, respectively. In the same way, we estimate a velocity dispersion of σmain = 999 ± 160, σSW = 792 ± 230 for the main body (assumed to be composed of 58 galaxies) and the southwestern clump, respectively. The 7 galaxies identified in the southern substructure seem to configure a small compact group of galaxies with very low σv. In this case, we were only able to estimate an upper limit of σS < 300 km s−1. Regarding the eastern substructure, we assume that the mean velocity should be similar to its corresponding BG (99 100 km s−1); and in agreement with the low galaxy density and the low X-ray emission observed, the velocity dispersion (in this case computed as the rms) of these three galaxies is σE ∼ 500 km s−1. We obtain velocity dispersions for the eastern and southern substructures as guide values, and only consider these in order to extract information about the magnitude and the importance of such galaxy clumps in the context of the whole RXCJ1230 cluster.
Given that galaxies are tracers of the gravitational potential of a halo, it is possible to estimate the dynamical mass of a system from its velocity dispersion. We use the calculated σv and its relation with M2006 to determine the dynamical mass of RXCJ1230 and its substructures. In the literature, there are many scaling relations that can be used to obtain dynamical masses of clusters from their velocity dispersion. Some examples are those obtained by Evrard et al. (2008), Saro et al. (2013), Munari et al. (2013) and Ferragamo et al. (2020). All of these produce very similar values for the dynamical mass. However, in this work, we follow the prescription of Munari et al. (2013; see Eq. (1) therein), given that the relation they obtain is constructed using very complete simulations, which take into account not only dark matter particles but also subhaloes, galaxies, and AGN feedback. Therefore, following the σv − M200 relation of Munari et al. (2013), we find dynamical masses of M200 = 9.0 ± 1.5 × 10¹⁴ M⊙ and 4.4 ± 3.3 × 10¹⁴ M⊙ for the main cluster and the southwestern substructure, respectively. Regarding the eastern substructure, the velocity dispersion estimate is very inaccurate. This makes very difficult to determine its mass with a minimum of precision. However, applying the again the σv − M200 scaling relation, we obtain a rough estimate of ∼1 × 10¹⁴ M⊙ for the eastern clump. In order to compare these values with others in the literature (which mainly refer to M500), M200 can also be converted into M500 following the relation given by Duffy et al. (2008). M500 has been rescaled from M200 assuming a concentration parameter c = 3.5 (an appropriate value for clusters at z = 0.3 and M200 = 1014 − 1015 M⊙), integrating a Navarro-Frenk-White (NFW) profile (Navarro et al. 1997) and interpolating to obtain M500. In this way, we obtain M500 = 5.6 ± 1.0 × 10¹⁴ M⊙ and 2.7 ± 2.0 × 10¹⁴ M⊙ for the main cluster and the southwestern substructure, respectively, and a rough (and qualitative) value of M500 ∼ 0.7 × 10¹⁴ M⊙ for the eastern clump.
In addition to the mass, we can also estimate the virial radius, r200, which provides information about the quasi-virialised region, as the radius of a sphere of mass M200 and 200 times the critical density of the Universe at the redshift of the system, 200ρc(z). Therefore,  H(z)2/G. Following this expression, we obtain r200 ∼ 1.8 and ∼1.5
  Mpc for the main body and the southwestern substructure, respectively. We compile the radius and mass estimates in Table 2.
As for the whole mass of the system, the contribution of the eastern and southern groups is of minor importance because they likely have low velocity dispersion and M200 scales with  . Thus, we can estimate a reliable total mass for the cluster as the sum of the main body and the other substructures; we obtain a total mass of M200 ≃ 1.4 ± 0.4 × 10¹⁵ M⊙.
In summary, RXCJ1230 is composed of a central main body accreting three substructures from its environment. The main substructure is the one to the southwest, which keeps a mass ratio of about 2:1 with respect to the main cluster. The substructure to the east is very small, because the velocity dispersion and mass estimate show a mass ratio of about 10:1 with respect to the main body. Something similar may occur with the southern substructure, which seems to be a very compact group with very low velocity dispersion. As we are not able to compute an accurate velocity dispersion for the E and S clumps, the values reported in Table 2 for these overdensities should be taken as qualitative results; however, they are important in order to characterise these minor subclumps. Our results agree with those of Böhringer et al. (2022) from X-ray data, supporting the validity of our findings.
4.1. Comparison with X-ray observations
By analysing X-ray data, Böhringer et al. (2022) also find a complex configuration of substructures around the main body of the cluster, which is elongated toward the south. The main substructure is placed to the southwest, while another minor clump is detected toward the east.
The detailed X-ray analysis of the RXCJ1230 complex is presented in Böhringer et al. (2022). In summary, these authors find that the X-ray temperature of the main body is 4.7 ± 0.4 keV, while the southwestern and eastern components show a TX = 4.4 ± 0.6 and 3.3 ± 0.6 keV, respectively. On the other hand, Böhringer et al. (2022) calculate the mass of gas inside r500, which is 3.45, 2.98, and 2.39 arcmin for the central, southwestern, and eastern cluster components, respectively, and use a β-model for the plasma density distribution. They assume a fix β-value of 2/3, which is typical for massive relaxed clusters. Finally, these authors adopted several scaling relations with LX, TX, YX, and Mgas and of M500(βfix) and find a total mass of M500, X = 7.7(±0.7) × 1014 M⊙.
The sum of dynamical masses corresponding to the main body and the southwestern clump, that is, the two main systems of RXCJ1230, is M500, dyn ≃ 9.0 ± 2.3 × 10¹⁴ M⊙. Comparing this value with that derived from X-ray, we see that M500, dyn and M500, X are in agreement within errors and they differ by about 15%.
Comparing the mass of individual clumps, Böhringer et al. (2022) find M500, X = 3.7 ± 0.5 × 10¹⁴ M⊙ within r500 in the main cluster, while we obtain M500, dyn = 5.6 ± 1.0 × 10¹⁴ M⊙. This discrepancy of about 30% may come from the fact that M500, dyn has been derived by converting M200 into M500. In fact, when considering only the 47 galaxy members with redshift within r500 (=3.45 arcmin =1 Mpc; see Table 3 in Böhringer et al. 2022), σv = 913 ± 133 km s−1 is obtained, which points to a mass of about M500, dyn ∼ 4.3 × 10¹⁴ M⊙, which is almost coincident with that derived from X-ray data. For the southwestern component, we find good agreement of the mass determination with M500, X = 2.5 ± 0.64 × 10¹⁴ M⊙ from X-rays and M500, dyn = 2.7 ± 2 × 10¹⁴ M⊙ from the galaxy dynamics. For the eastern component, a mass estimate is more difficult. However, even considering rough estimations, M500, dyn ∼ 1 × 10¹⁴ M⊙ and M500, X = 1.35 ± 0.3 × 10¹⁴ M⊙ roughly agree within errors.
5. Dynamics and merging
As pointed out above, both the main cluster and the three substructures are well detectable and optical and X-ray data indicate very similar locations. We are therefore seeing RXCJ1230 in a pre-merger phase. However, the velocity distribution and the not particularly well-resolved galaxy populations suggest that the substructures are starting to interact with the main cluster. With this scenario, the main collision will be produced between the substructure to the southwest involving a mass ratio of 2:1. We note that the X-ray temperatures of the main body and the substructure are very similar, namely TX, C = 4.7 ± 0.4 and TX, SW = 4.4 ± 0.6 keV (Böhringer et al. 2022) for the central main clump and the southwestern substructure, respectively, even though they show very different dynamical masses. Whereas typical X-ray temperatures of relaxed clusters with M500 ∼ 2.7 × 10¹⁴ M⊙ are about 3 keV (see e.g. Fig. 9 in Kettula et al. 2013, and references therein), the southwestern substructure could be starting to show an enhancement of its intra-cluster medium (ICM) temperature. This enhancement supports the fact that the main body and southwestern substructure are starting to collide.
When the merging scenario is assumed to explain an enhancement of the ICM temperature, a relative colliding velocity is needed to heat up the ICM (Gutierrez & Krawczynski 2005). Assuming that the two components are to cause a head-on collision and that their kinetic energies are completely converted to thermal energy, the colliding velocity is  km s−1, following prescriptions detailed in Shibata et al. (1999), where μ and mp are the mean molecular weight (0.6) in amu, and the proton mass, respectively. Therefore, assuming an excess temperature of kΔT ∼ 1.5 keV, we find vcoll ≃ 850 km s−1, which is in very good agreement with the observed relative LOS velocity in the cluster rest frame, as computed from (v̄C−v̄SW)/(1+z) = 869 km s−1.
Two-body merging model. We investigate the relative dynamics of the main body (C) of RXCJ1230 and its main substructure, the southwestern (SW) one, which dominates the dynamics of the whole cluster with a mass ratio about 2:1. The remaining interactions, involving the southern and eastern substructures, are minor merger events with mass ratios of about 10:1. We analyse this C–SW interaction using different approaches based on an energy integral formalism in the framework of locally flat spacetime and Newtonian gravity (see e.g. Beers et al. 1982). The three relevant observable quantities for the two system interactions are: the relative line-of-sight velocity, Vr = 869 ± 153 km s−1; the projected physical distance, D = 0.97  Mpc (3.38 arcmin); and the total mass of the two systems by adding the masses of the two clumps within r200, Msys ∼ 13.4 ± 3.6 × 10¹⁴ M⊙ (see Sect. 4).
First, we consider the Newtonian criterion for the gravitational binding, which follows the expression  , where α is the projection angle between the line connecting the centres of the two clumps and the plane of the sky. Figure 8 represents the two-body model obtained. Considering the value of Msys, the C–SW system is bound between 6° and 86° with a probability of
  (i.e. 89%).
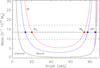 |
Fig. 8. Two-body model applied to the main cluster and southwestern galaxy substructure (C–SW system). The black curve separates bound and unbound regions according to the Newtonian criterion. Solid curves represent the bound incoming (BI) and bound outgoing (BO) solutions. Blue and red curves denote the models for 706 and 1022 km s−1, which represent the marginal relative velocity between main cluster and substructure, considering the corresponding uncertainties. The horizontal lines represent the observational values of the total mass of the C–SW system, with it uncertainty (dashed lines). |
We then apply the analytical two-body model introduced by Beers et al. (1982) and Thompson et al. (1982), (see also Lubin et al. 1998). This model assumes radial orbits and no rotation of the system. In addition, the clumps are assumed to start their evolution at t0 = 0 with a separation of d0 = 0 and are moving apart or coming together for the first time in the history. That is, with this model, we are assuming that we are seeing the cluster prior to collision (at t = 9.98 Gyr at the redshift of RXCJ1230). The solutions for this model are shown in Fig. 8, where we compare the total mass of the system, Msys, with the projection angle, α. The possible solutions span several cases: two bound incoming solutions (BIa and BIb) around 14°–20° and 74°–77°, respectively, and one bound outgoing (BO) at ∼85°. The incoming case is degenerated because of the ambiguity in the projection angle α. Therefore, for simplicity, we assume that the mean value in the incoming cases (BIa ∼ 17° and BIb ∼ 76°), and Msys values are equally probable for individual solutions. Under these assumptions, we estimate the following probabilities: PBIa ∼ 87%, PBIb ∼ 13%, and PBO ≪ 0.1%. We discard the BO solution because it is very unlikely and we analyse the BI ones below.
Between the two possible incoming solutions, α = 17° and α = 76°, the second one is quite unlikely. The solution of α = 76° (associated to the BIb solution) would imply a distance between clumps of ∼4.0  Mpc, which is more than twice r200. On the other hand, α = 17° (BIa) is the most likely solution, and for this case, the distance between the centres of C and SW would be ∼1.0
  Mpc, which would explain a certain degree of interaction. Thus, when assuming α = 17°, the colliding velocity would be ∼3000 km s−1 and the cluster clumps would cross after ∼0.3 Gyr.
We acknowledge that the characterisation of the dynamics of RXCJ1230 through these models is affected by several limitations. First, the two-body model does not consider the possibility of an off-axis merger, or a mass distribution in the subclusters. Secondly, this study does not take into account the presence of minor subclusters (the southern and eastern clumps). Therefore, the model presented here remains one of the many possible collision scenarios for RXCJ1230.
6. Summary and Conclusions
We present findings for the kinematical and dynamical state of the complex galaxy cluster RXCJ1230.7+3439. Our study is based on new spectroscopic redshifts acquired at the 3.5m TNG telescope covering a region of ∼8′ × 8′. We also consider some SDSS DR16 spectroscopic redshifts in order to complement our sample. In addition, we use the SDSS photometry in a field of ∼13′ × 10′ to analyse the spatial distribution of likely cluster members. We select 77 galaxy cluster members around z = 0.332 and compute a LOS global velocity dispersion of  km s−1.
Our analysis confirms the presence of three substructures surrounding the main body of the cluster, which are clearly recognisable in the plane of the sky in the 2D spatial distribution of galaxies. Moreover, we identify several bright galaxies dominating the core of each substructure. The most massive substructure is that located to the southwest, which shows σv ∼ 800 km s−1 and differs by ∼870 km s−1 from the main body in the LOS velocity. The southern substructure resembles a compact group of galaxies with very low velocity dispersion (σS < 300 km s−1), while we find that the eastern substructure shows σE ∼ 500 km s−1. The dynamical masses estimated from these velocity dispersions are M200 = 9.0 ± 1.5 × 10¹⁴ M⊙, 4.4 ± 3.3 × 10¹⁴ M⊙, and ∼1 × 10¹⁴ M⊙ for the main cluster and the southwestern and eastern substructures, respectively. Considering the complex structure of RXCJ1230, we estimate that the whole cluster contains a total mass in the range of M200 ≃ 1.4 ± 0.4 × 10¹⁵.
Given that the galaxy density peaks coincide with those observed in X-ray surface brightness, we infer that the system is taking part in a pre-merger event, where the main collision is that involving the main body and the southwestern clump. This interaction occurs with a mass ratio of 2:1 and an impact velocity of Δvrf ∼ 3000 km s−1. The most likely solution obtained from a two-body problem for these two systems suggests that the merging axis lies at ∼17° ( ± 3°) with respect to the plane of the sky and the systems will be completely joined in about 0.3 Gyr. However, a slight increase in the X-ray temperature (kΔT ∼ 1.5 keV) to the southwest may indicate that we are already observing a certain degree of interaction.
dered magnitudes are the extinction-corrected values following Schlegel et al. (1998) reddening maps.
Including a fourth galaxy clump with the three easternmost galaxies does not produce a reliable KMM test result.
r200 is defined as the radius inside which the average mass density in the cluster is 200 times the critical density of the Universe at the cluster redshift. Similarly to r500 for its corresponding mass density. Therefore, M200 and M500 are the virial mass contained within r200 and r500, respectively.
Acknowledgments
We thank to the referee for his useful comments, which have really helped the authors to improve this work. R. Barrena acknowledges support by the Severo Ochoa 2020 research programme of the Instituto de Astrofísica de Canarias. H. Böhringer acknowledges support from the Deutsche Forschungsgemeinschaft through the Excellence cluster “Origins”. G. Chon acknowledges support by the DLR under the grant n° 50 OR 1905. This article is based on observations made with the Italian Telescopio Nazionale Galileo operated by the Fundación Galileo Galilei of the INAF (Istituto Nazionale di Astrofisica). This facility is located at the Spanish del Roque de los Muchachos Observatory of the Instituto de Astrofísica de Canarias on the island of La Palma. Funding for the Sloan Digital Sky Survey (SDSS) has been provided by the Alfred P. Sloan Foundation, the Participating Institutions, the National Aeronautics and Space Administration, the National Science Foundation, the U.S. Department of Energy, the Japanese Monbukagakusho, and the Max Planck Society. The Pan-STARRS1 Surveys (PS1) and the PS1 public science archive have been made possible through contributions by the Institute for Astronomy, the University of Hawaii, the Pan-STARRS Project Office, the Max-Planck Society and its participating institutes, the Max Planck Institute for Astronomy, Heidelberg and the Max Planck Institute for Extraterrestrial Physics, Garching, The Johns Hopkins University, Durham University, the University of Edinburgh, the Queen’s University Belfast, the Harvard-Smithsonian Center for Astrophysics, the Las Cumbres Observatory Global Telescope Network Incorporated, the National Central University of Taiwan, the Space Telescope Science Institute, the National Aeronautics and Space Administration under Grant No. NNX08AR22G issued through the Planetary Science Division of the NASA Science Mission Directorate, the National Science Foundation Grant No. AST-1238877, the University of Maryland, Eotvos Lorand University (ELTE), the Los Alamos National Laboratory, and the Gordon and Betty Moore Foundation.
References
- Allen, S. W., Evrard, A. E., & Mantz, A. B. 2011, ARA&A, 49, 409 [Google Scholar]
- Appenzeller, I., Thiering, I., & Zickgraf, F. J. 1998, ApJS, 117, 319 [NASA ADS] [CrossRef] [Google Scholar]
- Ashman, K. M., Bird, C. M., & Zepf, S. E. 1994, AJ, 108, 2348 [Google Scholar]
- Barrena, R., Boschin, W., Girardi, M., et al. 2007, A&A, 467, 37 [NASA ADS] [CrossRef] [EDP Sciences] [Google Scholar]
- Barrena, R., Girardi, M., Boschin, W., et al. 2012, A&A, 540, A90 [NASA ADS] [CrossRef] [EDP Sciences] [Google Scholar]
- Beers, T. C., Geller, M. J., & Huchra, J. P. 1982, ApJ, 257, 23 [NASA ADS] [CrossRef] [Google Scholar]
- Beers, T. C., Flynn, K., & Gebhardt, K. 1990, AJ, 100, 32 [Google Scholar]
- Biviano, A. 2000, in IAP 2000 meeting, eds. F. Durret, & D. Gerbal [Google Scholar]
- Böhringer, H., & Werner, N. 2010, A&A Rv., 18, 127 [Google Scholar]
- Böhringer, H., Voges, W., & Huchra, J. P. 2000, ApJS, 129, 435 [CrossRef] [Google Scholar]
- Böhringer, H., Chon, G., Ellis, R. S., et al. 2022, A&A in press, https://doi.org/10.1051/0004-6361/202243424 [Google Scholar]
- Boschin, W., Girardi, M., & Barrena, R. 2013, MNRAS, 434, 772 [NASA ADS] [CrossRef] [Google Scholar]
- Dressler, A., & Shectman, S. A. 1988, AJ, 95, 985 [Google Scholar]
- Duffy, A. R., Schaye, J., Kay, S. T., et al. 2008, MNRAS, 390, L64 [NASA ADS] [CrossRef] [Google Scholar]
- Eales, S. A., Baes, M., Bourne, N., et al. 2018, MNRAS, 481, 1183 [NASA ADS] [CrossRef] [Google Scholar]
- Evrard, A. E., Blalek, J., Busha, M., et al. 2008, ApJ, 672, 122 [NASA ADS] [CrossRef] [Google Scholar]
- Ferragamo, A., Rubiño-Martín, J. A., Betancort-Rijo, J., et al. 2020, A&A, 641, A41 [NASA ADS] [CrossRef] [EDP Sciences] [Google Scholar]
- Gal, R. R., del Carvalho, R. R., & Lopes, P. A. A. 2003, AJ, 125, 2064 [NASA ADS] [CrossRef] [Google Scholar]
- Golovich, N., Dawson, W. A., Wittman, D. M., et al. 2019, ApJS, 240, 39 [NASA ADS] [CrossRef] [Google Scholar]
- Gutierrez, K., & Krawczynski, H. 2005, ApJ, 619, 161 [NASA ADS] [CrossRef] [Google Scholar]
- Hao, J., McKay, T. A., Koester, B. P., et al. 2010, ApJS, 191, 254 [Google Scholar]
- Kennicutt, R. C. 1992, ApJS, 79, 255 [NASA ADS] [CrossRef] [Google Scholar]
- Kettula, K., Finoguenov, A., Massey, R., et al. 2013, ApJ, 778, 74 [NASA ADS] [CrossRef] [Google Scholar]
- Laganá, T. F., Lima Neto, G. B., Andrade-Santos, F., et al. 2008, A&A, 485, 633 [NASA ADS] [CrossRef] [EDP Sciences] [Google Scholar]
- Loewenstein, M. 2003, Origin and Evolution of the Elements (Cambridge University Press), 4, 422 [NASA ADS] [Google Scholar]
- Lubin, L. M., Postman, M., & Oke, J. B. 1998, AJ, 116, 643 [NASA ADS] [CrossRef] [Google Scholar]
- Mamon, G., Biviano, A., & Murante, G. 2010, A&A, 520, A30 [NASA ADS] [CrossRef] [EDP Sciences] [Google Scholar]
- Munari, E., Biviano, A., Borgani, S., et al. 2013, MNRAS, 430, 2638 [NASA ADS] [CrossRef] [Google Scholar]
- Navarro, J. F., Frenk, C. S., & White, S. D. M. 1997, ApJ, 490, 493 [Google Scholar]
- Planck Collaboration XXVII. 2016, A&A, 594, A27 [NASA ADS] [CrossRef] [EDP Sciences] [Google Scholar]
- Ribeiro, A. L. B., Lopes, P. A. A., & Trevisan, M. 2011, MNRAS, 413, L81 [NASA ADS] [Google Scholar]
- Roettiger, K., Loken, C., & Burns, J. O. 1997, ApJS, 109, 307 [NASA ADS] [CrossRef] [Google Scholar]
- Saro, A., Mohr, J. J., Bazin, G., et al. 2013, ApJ, 772, 47 [NASA ADS] [CrossRef] [Google Scholar]
- Schlegel, D. J., Finkbeiner, D. P., & Davis, M. 1998, ApJ, 500, 525 [Google Scholar]
- Shibata, R., Honda, H., Ishida, M., et al. 1999, ApJ, 524, 603 [NASA ADS] [CrossRef] [Google Scholar]
- Springel, V. 2005, MNRAS, 364, 1105 [Google Scholar]
- Thompson, L. A. 1982, in Early Evolution of the Universe and the Present Structure, eds. G. O. Abell, & G. Chincarini (Dordrecht: Reidel), IAU Symp., 104 [Google Scholar]
- Tonry, J., & Davis, M. 1979, ApJ, 84, 1511 [Google Scholar]
- Umetsu, K. 2000, A&A Rv., 28, 7 [NASA ADS] [Google Scholar]
- van Weeren, R. J., de Gasperin, F., Akamatsu, H., et al. 2019, Space Sci. Rev., 215, 16 [Google Scholar]
- Wen, Z. L., Han, J. L., & Liu, F. S. 2009, ApJS, 183, 197 [NASA ADS] [CrossRef] [Google Scholar]
All Tables
Velocity catalogue of 93 galaxies measured spectroscopically in the RXJ1230 field.
Positions and global properties of the whole cluster and the four galaxy clumps detected in RXCJ1230.
All Figures
|
Fig. 1. Left panel: RGB colour composite image obtained by combining g′-, r′-, and i′-band images of 13′ × 10′ field of view from Pan-Starrs1 public archive. Circles and squares correspond to galaxy members and non-members, respectively, obtained from our spectroscopic observations and SDSS-DR16 spectroscopic database. Superimposed, we also show the contour levels of isodensity galaxy distribution of likely members (see Sect. 3.3). Right panel: same RGB image but overplotting the contour levels of the XMM-Newton image corresponding to the observation ID 0841900101. The X-ray contours were obtained after smoothing the original image using a Gaussian filter with σ = 6 arcsec. Point sources and emission from NVSS 123050+344257 radio galaxy (ID 78) have been removed, masking them with circular apertures of 10–20 pixels radius. In both panels, the BCG and BGs are also marked. North is up and east is left. |
| In the text | |
|
Fig. 2. Galaxy redshift distribution. Dashed vertical lines delimit the redshift range including 77 galaxy members assigned to RXCJ1230 according to 2.7σv clipping. The velocity distribution in the cluster rest frame of the 77 cluster members selected is superimposed. The black curve represents the reconstruction of the velocity distribution as a Gaussian profile, considering the σv computed using the biweight estimator and assuming all the galaxies belong to a single system. The velocity corresponding to the BCG is also marked. |
| In the text | |
|
Fig. 3. Top panel: rest frame velocity versus projected distance to the cluster centre for the 77 galaxy members selected. The cluster centre is assumed to be the position of the BCG. Middle and bottom panels: integral profiles and LOS velocity dispersion, respectively. These values are computed by considering all galaxies within that radius. The first value computed is estimated from the first five galaxies closest to the centre. The error bars are at the 68% c.l. |
| In the text | |
|
Fig. 4. Colour–magnitude diagram (r′−i′,r′) of galaxies in a region of 12.4′ × 9.6′. Red symbols correspond to galaxy members confirmed spectroscopically (red dot corresponds to the BCG of the cluster). The solid line represents the red sequence defined as the densest locus in this diagram, which follows the linear fit r′−i′ = − 0.028 * r′+1.118. Dashed lines delimit the region that encloses the RS and the blue cloud in this diagram. Galaxies included in this region are considered likely members, which are used to obtain the isodensity galaxy distribution shown in Fig. 1. |
| In the text | |
|
Fig. 5. Isodensity contours of spectroscopically confirmed galaxy members. Blue contours corresponds to the 2D distribution of galaxies with negative velocity with respect to the mean velocity in the cluster rest frame (see Fig. 2, inner panel). Similarly, red contours show isodensity levels for galaxies with positive velocity with respect to the mean cluster velocity. This plot is centred on the BCG marked with a large big dot. Blue dots correspond to BGs belonging to the corresponding clumps. Red and blue contours are plotted at the same density level. |
| In the text | |
|
Fig. 6. Spatial distribution of the 77 cluster members, each marked by a square. The sizes of the squares are proportional to exp(δi), which is computed using the δi deviations obtained in the DS test. Red and blue squares separate populations showing deviations lower and higher than |
| In the text | |
|
Fig. 7. Spatial distribution on the sky of the 77 cluster members. The 9 blue and 7 green dots correspond to the galaxies belonging to the southwestern and southern substructures identified with > 95% probability using the KMM procedure. Red dots correspond to galaxy members that are part of the cluster main body with different probabilities following the same algorithm. Black dots correspond to galaxies selected manually as part of the eastern clump according to their space–velocity segregation (see Fig. 5). Large dots mark the BCG and BGs. |
| In the text | |
|
Fig. 8. Two-body model applied to the main cluster and southwestern galaxy substructure (C–SW system). The black curve separates bound and unbound regions according to the Newtonian criterion. Solid curves represent the bound incoming (BI) and bound outgoing (BO) solutions. Blue and red curves denote the models for 706 and 1022 km s−1, which represent the marginal relative velocity between main cluster and substructure, considering the corresponding uncertainties. The horizontal lines represent the observational values of the total mass of the C–SW system, with it uncertainty (dashed lines). |
| In the text | |
Current usage metrics show cumulative count of Article Views (full-text article views including HTML views, PDF and ePub downloads, according to the available data) and Abstracts Views on Vision4Press platform.
Data correspond to usage on the plateform after 2015. The current usage metrics is available 48-96 hours after online publication and is updated daily on week days.
Initial download of the metrics may take a while.