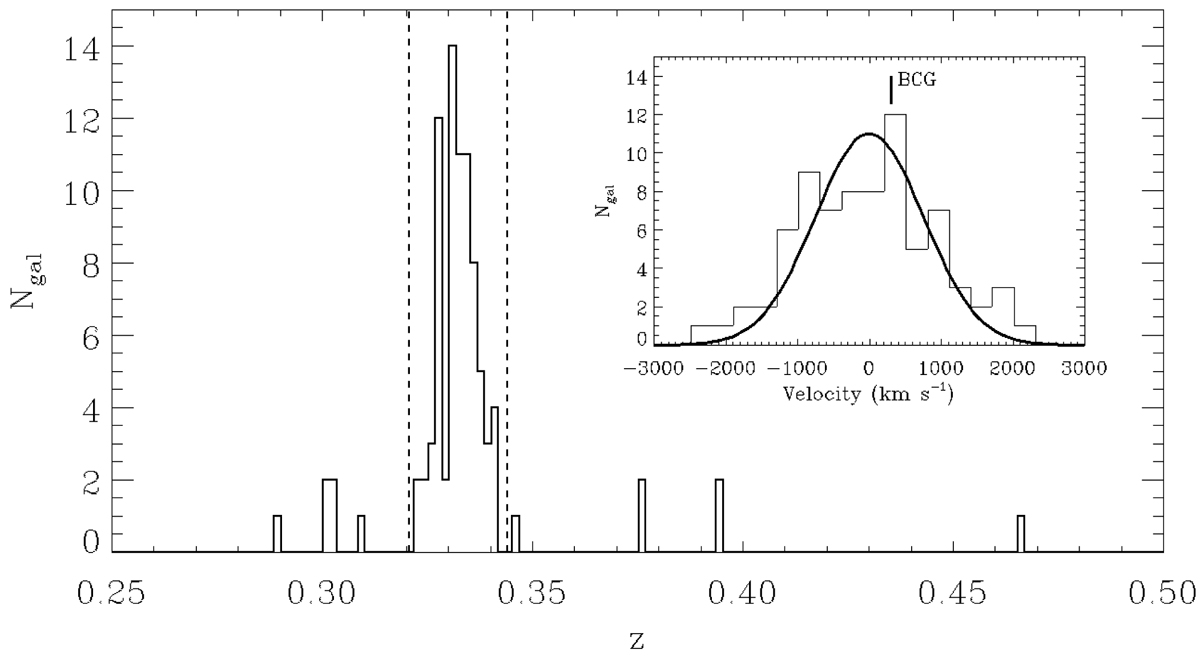
Fig. 2.
Download original image
Galaxy redshift distribution. Dashed vertical lines delimit the redshift range including 77 galaxy members assigned to RXCJ1230 according to 2.7σv clipping. The velocity distribution in the cluster rest frame of the 77 cluster members selected is superimposed. The black curve represents the reconstruction of the velocity distribution as a Gaussian profile, considering the σv computed using the biweight estimator and assuming all the galaxies belong to a single system. The velocity corresponding to the BCG is also marked.
Current usage metrics show cumulative count of Article Views (full-text article views including HTML views, PDF and ePub downloads, according to the available data) and Abstracts Views on Vision4Press platform.
Data correspond to usage on the plateform after 2015. The current usage metrics is available 48-96 hours after online publication and is updated daily on week days.
Initial download of the metrics may take a while.