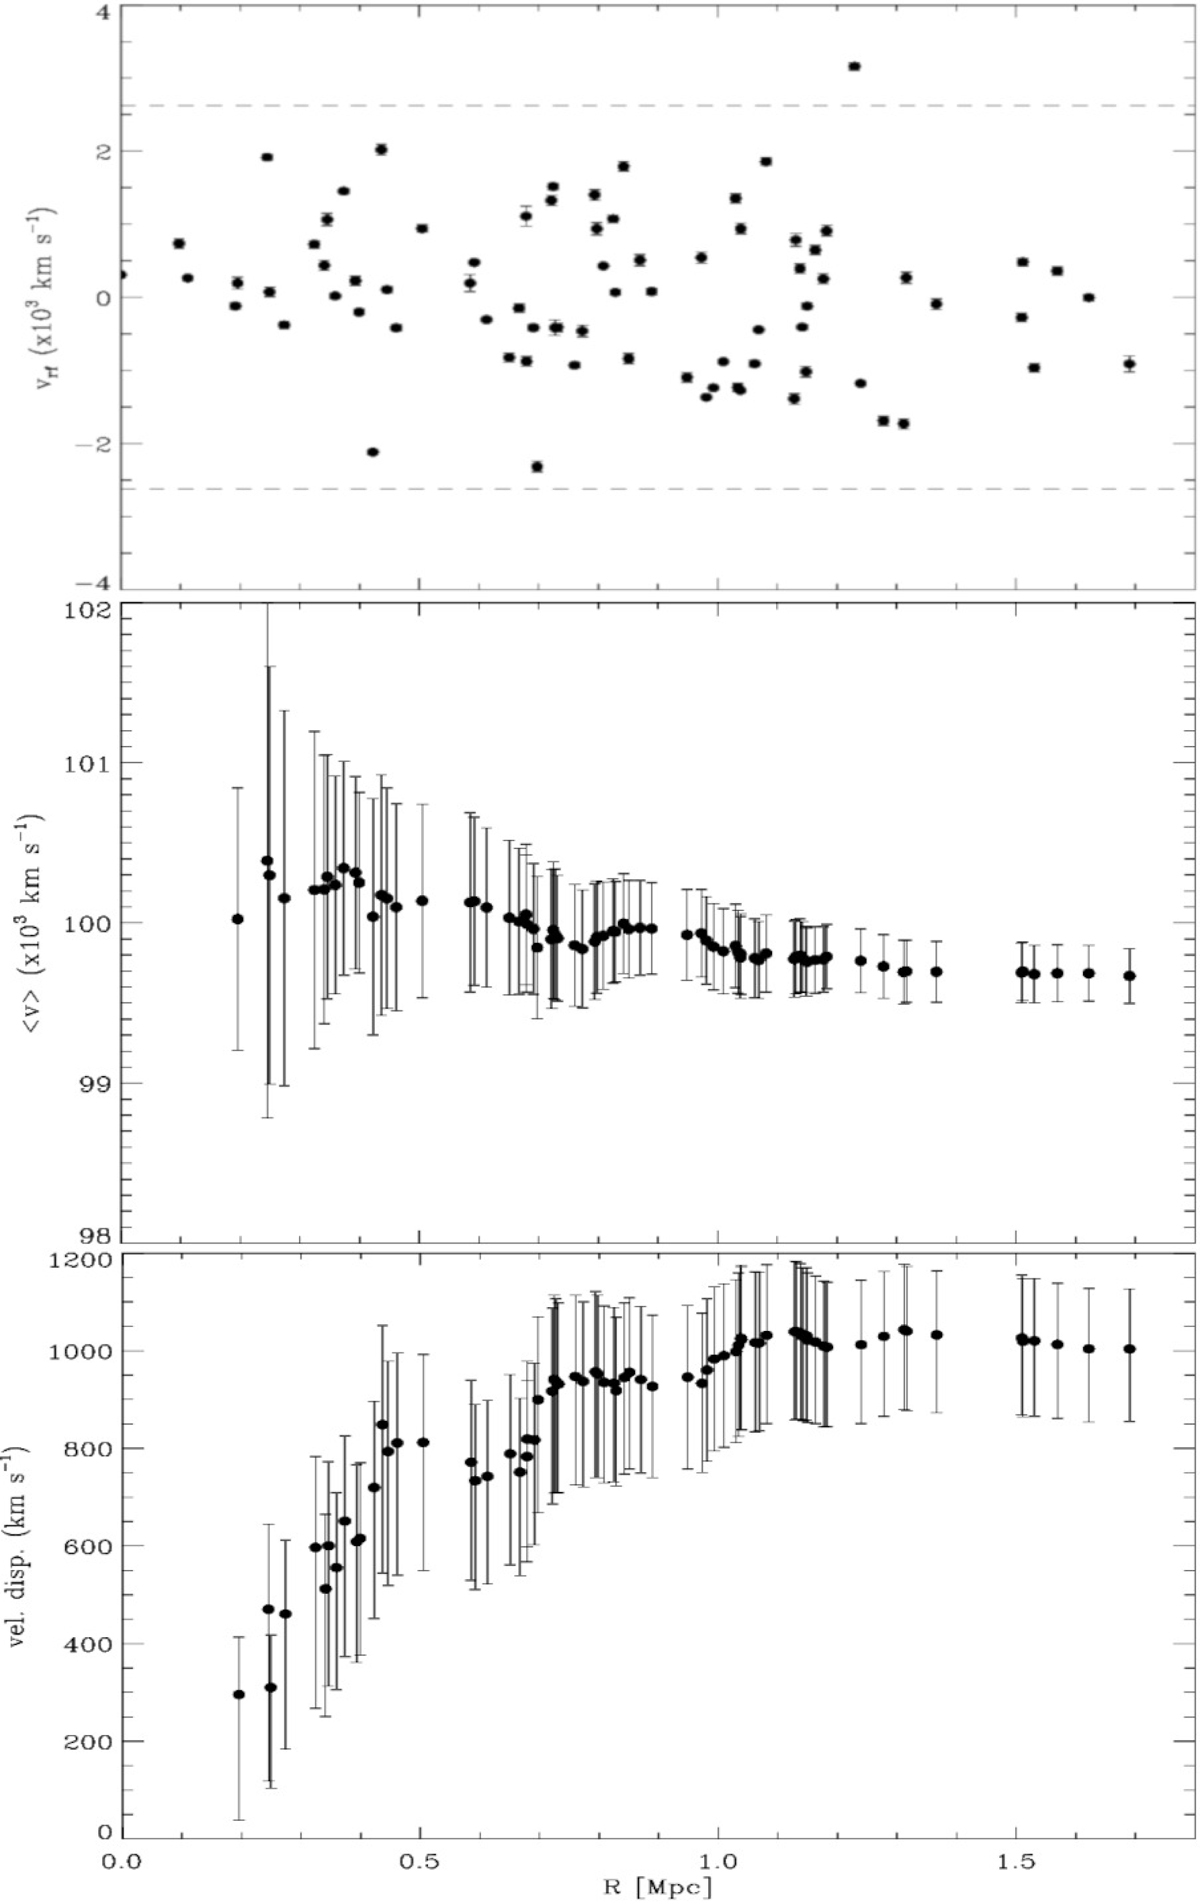
Fig. 3.
Download original image
Top panel: rest frame velocity versus projected distance to the cluster centre for the 77 galaxy members selected. The cluster centre is assumed to be the position of the BCG. Middle and bottom panels: integral profiles and LOS velocity dispersion, respectively. These values are computed by considering all galaxies within that radius. The first value computed is estimated from the first five galaxies closest to the centre. The error bars are at the 68% c.l.
Current usage metrics show cumulative count of Article Views (full-text article views including HTML views, PDF and ePub downloads, according to the available data) and Abstracts Views on Vision4Press platform.
Data correspond to usage on the plateform after 2015. The current usage metrics is available 48-96 hours after online publication and is updated daily on week days.
Initial download of the metrics may take a while.