Fig. 4.
Download original image
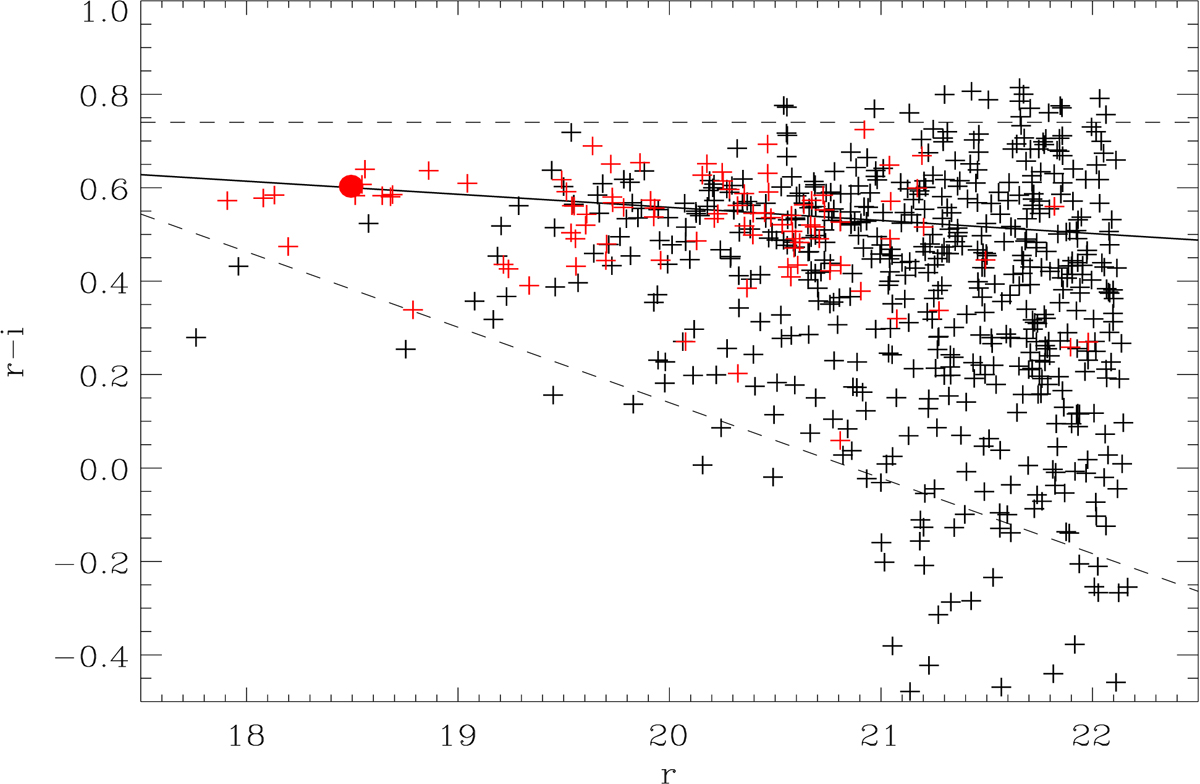
Colour–magnitude diagram (r′−i′,r′) of galaxies in a region of 12.4′ × 9.6′. Red symbols correspond to galaxy members confirmed spectroscopically (red dot corresponds to the BCG of the cluster). The solid line represents the red sequence defined as the densest locus in this diagram, which follows the linear fit r′−i′ = − 0.028 * r′+1.118. Dashed lines delimit the region that encloses the RS and the blue cloud in this diagram. Galaxies included in this region are considered likely members, which are used to obtain the isodensity galaxy distribution shown in Fig. 1.
Current usage metrics show cumulative count of Article Views (full-text article views including HTML views, PDF and ePub downloads, according to the available data) and Abstracts Views on Vision4Press platform.
Data correspond to usage on the plateform after 2015. The current usage metrics is available 48-96 hours after online publication and is updated daily on week days.
Initial download of the metrics may take a while.