Fig. 8.
Download original image
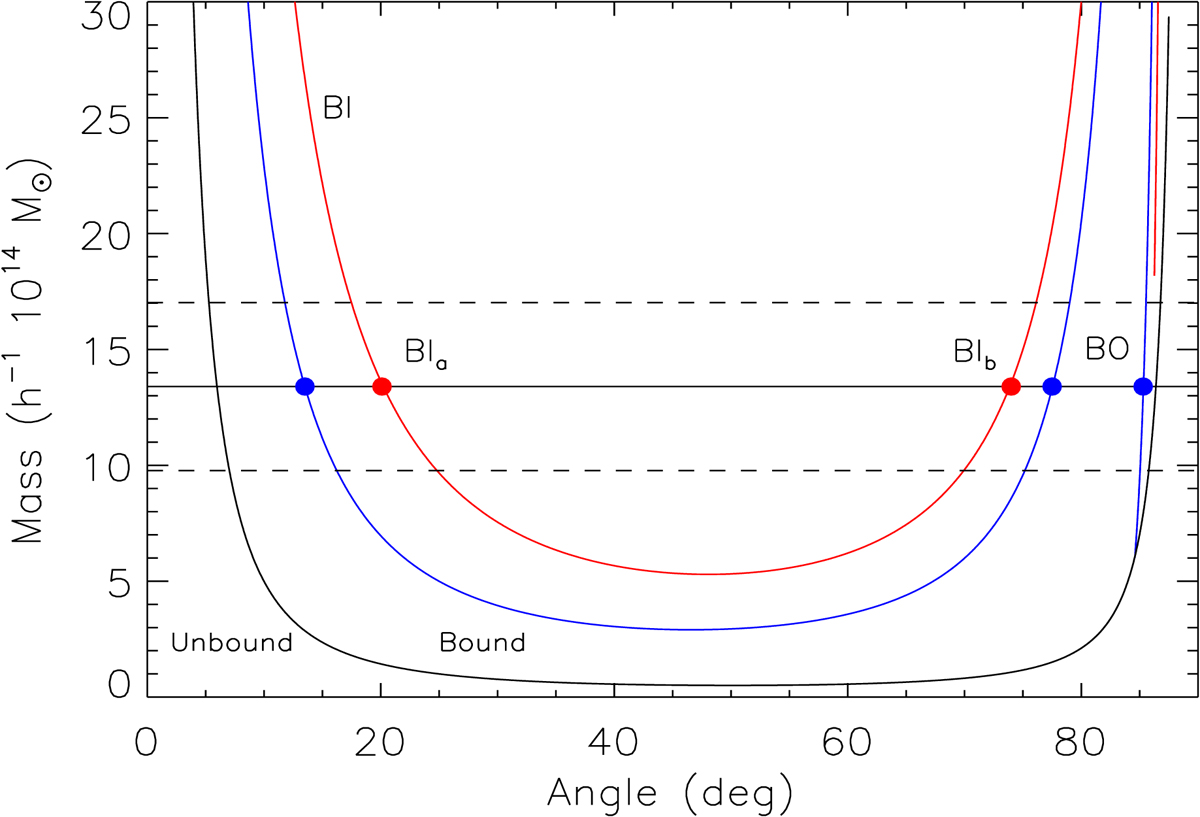
Two-body model applied to the main cluster and southwestern galaxy substructure (C–SW system). The black curve separates bound and unbound regions according to the Newtonian criterion. Solid curves represent the bound incoming (BI) and bound outgoing (BO) solutions. Blue and red curves denote the models for 706 and 1022 km s−1, which represent the marginal relative velocity between main cluster and substructure, considering the corresponding uncertainties. The horizontal lines represent the observational values of the total mass of the C–SW system, with it uncertainty (dashed lines).
Current usage metrics show cumulative count of Article Views (full-text article views including HTML views, PDF and ePub downloads, according to the available data) and Abstracts Views on Vision4Press platform.
Data correspond to usage on the plateform after 2015. The current usage metrics is available 48-96 hours after online publication and is updated daily on week days.
Initial download of the metrics may take a while.