Fig. 5.
Download original image
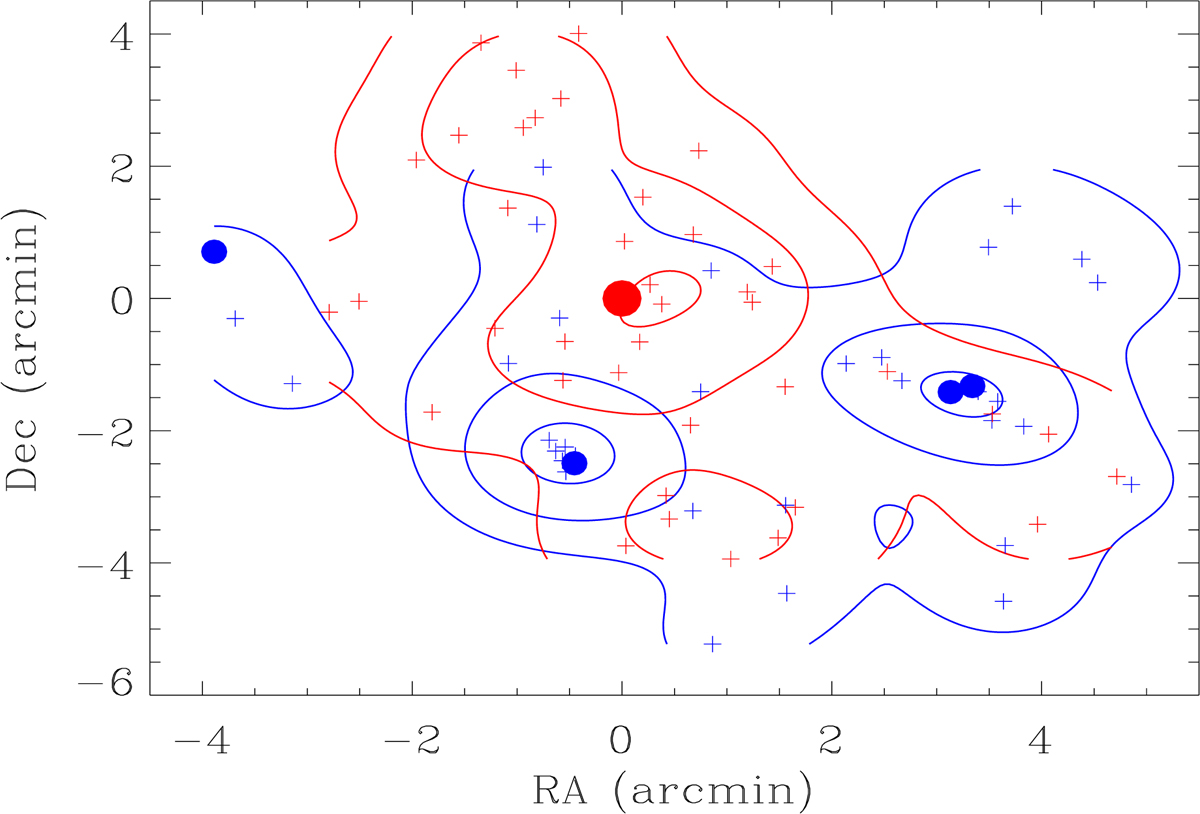
Isodensity contours of spectroscopically confirmed galaxy members. Blue contours corresponds to the 2D distribution of galaxies with negative velocity with respect to the mean velocity in the cluster rest frame (see Fig. 2, inner panel). Similarly, red contours show isodensity levels for galaxies with positive velocity with respect to the mean cluster velocity. This plot is centred on the BCG marked with a large big dot. Blue dots correspond to BGs belonging to the corresponding clumps. Red and blue contours are plotted at the same density level.
Current usage metrics show cumulative count of Article Views (full-text article views including HTML views, PDF and ePub downloads, according to the available data) and Abstracts Views on Vision4Press platform.
Data correspond to usage on the plateform after 2015. The current usage metrics is available 48-96 hours after online publication and is updated daily on week days.
Initial download of the metrics may take a while.