Fig. 7.
Download original image
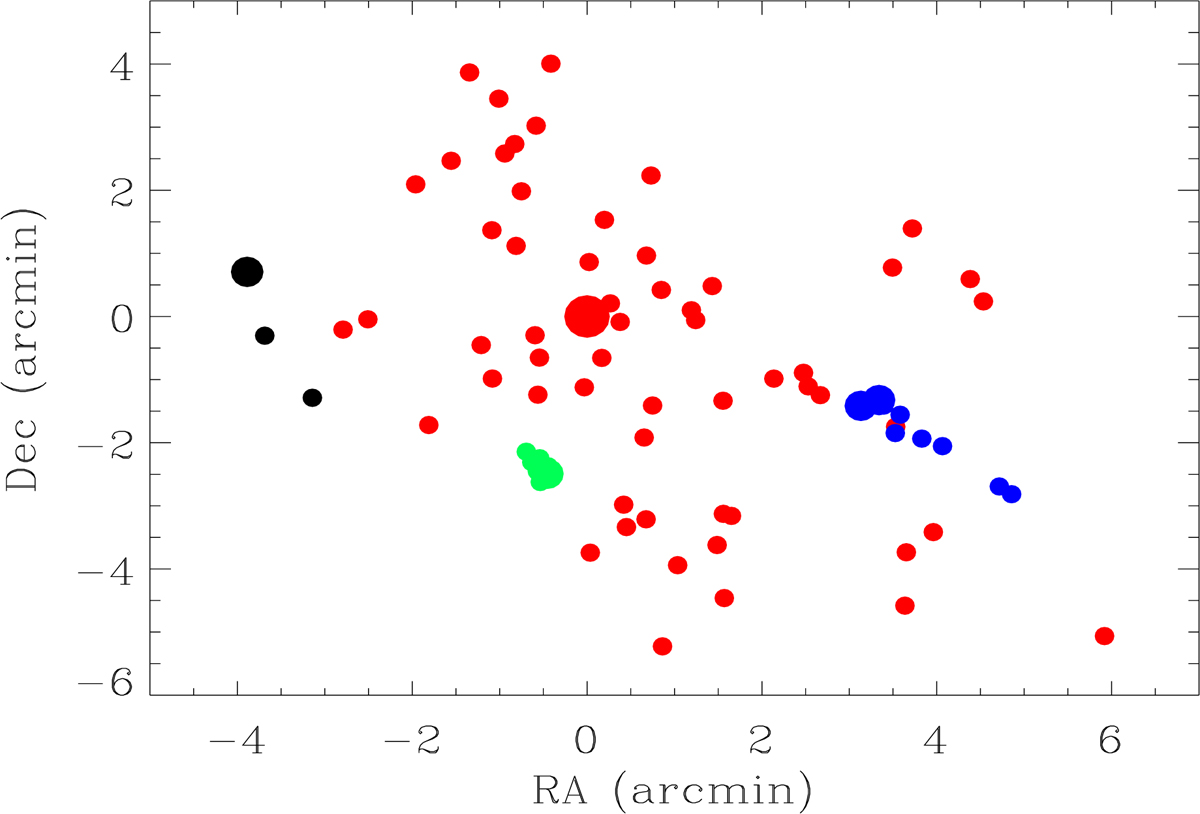
Spatial distribution on the sky of the 77 cluster members. The 9 blue and 7 green dots correspond to the galaxies belonging to the southwestern and southern substructures identified with > 95% probability using the KMM procedure. Red dots correspond to galaxy members that are part of the cluster main body with different probabilities following the same algorithm. Black dots correspond to galaxies selected manually as part of the eastern clump according to their space–velocity segregation (see Fig. 5). Large dots mark the BCG and BGs.
Current usage metrics show cumulative count of Article Views (full-text article views including HTML views, PDF and ePub downloads, according to the available data) and Abstracts Views on Vision4Press platform.
Data correspond to usage on the plateform after 2015. The current usage metrics is available 48-96 hours after online publication and is updated daily on week days.
Initial download of the metrics may take a while.