| Issue |
A&A
Volume 666, October 2022
|
|
|---|---|---|
| Article Number | A73 | |
| Number of page(s) | 15 | |
| Section | Planets and planetary systems | |
| DOI | https://doi.org/10.1051/0004-6361/202243262 | |
| Published online | 11 October 2022 | |
Toward a population synthesis of disks and planets
I. Evolution of dust with entrainment in winds and radiation pressure
1
Max-Planck-Institut für Astronomie,
Königstuhl 17,
69117
Heidelberg, Germany
e-mail: burn@mpia.de
2
University Observatory, Faculty of Physics, Ludwig-Maximilians-Universität München,
Scheinerstr. 1,
81679
Munich, Germany
3
Physikalisches Institut, University of Bern,
Gesellschaftsstrasse 6,
3012
Bern, Switzerland
4
Exzellenzcluster ORIGINS,
Boltzmannstr. 2,
85748
Garching, Germany
Received:
3
February
2022
Accepted:
9
July
2022
Context. Millimeter astronomy provides valuable information on the birthplaces of planetary systems. In order to compare theoretical models with observations, the dust component has to be carefully calculated.
Aims. Here, we aim to study the effects of dust entrainment in photoevaporative winds, and the ejection and drag of dust due to the effects caused by radiation from the central star.
Methods. We improved and extended the existing implementation of a two-population dust and pebble description in the global Bern/Heidelberg planet formation and evolution model. Modern prescriptions for photoevaporative winds were used and we accounted for settling and advection of dust when calculating entrainment rates. In order to prepare for future population studies with varying conditions, we explored a wide range of disk, photoevaporation, and dust parameters.
Results. If dust can grow to pebble sizes, that is, if they are resistant to fragmentation or turbulence is weak, drift dominates and the entrained mass is small but larger than under the assumption of no vertical advection of grains with the gas flow. For the case of fragile dust shattering at velocities of 1m s−1 – as indicated in laboratory experiments –, an order of magnitude more dust is entrained, which becomes the main dust removal process. Radiation pressure effects disperse massive, dusty disks on timescales of a few hundred Myr.
Conclusions. These results highlight the importance of dust entrainment in winds as a solid-mass removal process. Furthermore, this model extension lays the foundations for future statistical studies of the formation of planets in their birth environment.
Key words: planets and satellites: formation / protoplanetary disks / stars: protostars
© R. Burn et al. 2022
 Open Access article, published by EDP Sciences, under the terms of the Creative Commons Attribution License (https://creativecommons.org/licenses/by/4.0), which permits unrestricted use, distribution, and reproduction in any medium, provided the original work is properly cited.
This article is published in open access under the Subscribe-to-Open model.
Open Access funding provided by Max Planck Society.
1 Introduction
The recent advances in millimeter astronomy, mainly thanks to the Atacama Large Millimeter/Submillimeter Array (ALMA), enable the detailed study of dust content in protoplanetary disks surrounding young stars, where planets form. Surveys of star-forming regions (e.g., Ansdell et al. 2016, 2017, 2018; Pascucci et al. 2016; Barenfeld et al. 2016) give a statistical overview of the properties of these disks. These data provide unprecedented evidence on planet formation processes. To make use of these constraints, it is necessary to model the dust evolution in theoretical studies of planet formation. This has been addressed by a number of dedicated studies in different numbers of dimensions and degrees of complexity (e.g., Birnstiel et al. 2016, for a review). Simplified models of the process (e.g., two-population model by Birnstiel et al. 2012) benefit from fast computational times, and therefore usability in planetary population synthesis studies (Voelkel et al. 2020). However, these models were initially developed to predict pebble fluxes for constraining planetary growth without comparison to millimeter observations in mind.
In particular, more research is needed for cases and disk regions where the bulk of the solids do not grow to pebble size and do not drift toward the star (Weidenschilling 1977), and additionally where the gas is not viscously accreted toward the star.
This happens commonly if the solids are fragile (as indicated in recent laboratory experiments by Steinpilz et al. 2019), or if turbulence is vigorous.
To that end, it is important to include additional processes that influence the dust and pebbles in these regions. An example process is dust entrainment in photoevaporative winds (Owen et al. 2011b; Facchini et al. 2016; Hutchison et al. 2016; Franz et al. 2020, 2022a,b). The research interest in this topic laid mainly on the potential observability of entrained dust in winds until Sellek et al. (2020, hereafter S20), accounted for dust entrainment in an evolutionary model for the first time. They find that a significant mass fraction of dust can be removed by this process in disks subject to external photoevaporation. Similarly, dust entrainment in X-ray photoevaporative winds was included in the dust evolution calculations of Gárate et al. (2021), although without in-depth analysis or discussion of this particular effect.
Other effects that possibly have an influence on the dust mass content are known from the fields of debris disk and Solar System studies. We study here the effects caused by radiation pressure, which leads to Poynting–Robertson drag or direct ejection of dust (Robertson & Russell 1937; Burns et al. 1979; Klahr & Lin 2001; Wyatt 2008). The requirement for these processes to become efficient is an optically thin disk, in order for radiation to reach the dust grains.
Here, we extend the two-population dust evolution model of Birnstiel et al. (2012) implemented in a global model of planet formation and evolution (Emsenhuber et al. 2021; Voelkel et al. 2020) to include these processes. This marks an important step toward a planetary population synthesis model, which at the same time can be tested against millimeter observations. Furthermore, we assess the effect of dust entrainment in photoevaporative winds using the modern prescriptions for internal, X-ray and extreme ultraviolet (XEUV) photoevaporation by Picogna et al. (2019) – recently updated by Picogna et al. (2021) and Ercolano et al. (2021) – and for the external photoevaporation by Haworth et al. (2018). At the same time, we further explore the effects of the settling of dust grains (similar to Franz et al. 2022a) counteracted by vertical transport (Booth & Clarke 2021).
This paper is the first part of a series that includes the training of a statistical, surrogate model for fast comparison with observations in part two, and a Bayesian retrieval of initial disk conditions for unperturbed disks based on observations in part three. We present a complete gas and dust disk model description in Sect. 2 and show the effects of different model choices and parameters in Sects. 3.1-3.2, respectively. We put the results into perspective in Sect. 4, before summarizing the findings and concluding (Sect. 5).
2 Model
2.1 Viscous gas disk
Owing to the fact that this work is mostly about disks, we recall here the general description of a standard (see also Emsenhuber et al. 2021), one-dimensional, viscous disk. Initially, the gas disk surface density profile as a function of distance to the star r follows:

where βg is the slope of the gas disk, r0 = 5.2 au is chosen as a reference distance, rout is the outer exponential cut-off radius, and rin is the disk inner edge.
The evolution over time t of the surface density  for the midplane volume density ρg of a viscous disk with Keplerian orbital velocities
 as dictated by mass and angular momentum conservation (von Weizsäcker 1948; Lynden-Bell & Pringle 1974; Pringle 1981) is:

where the viscosity v = αcsHg is parameterized using the Shakura & Sunyaev (1973) α-viscosity,  is the midplane isothermal sound speed, Hg = cs/ΩK is the local disk scale height, kB is Boltzmann’s constant, µ is the mean molecular weight in units of hydrogen atom masses mH, and
  and
and  are additional terms for the losses by internal and external photoevaporation, respectively (see below).
The disk midplane temperature Tmid is given following the analytical approximation from Nakamoto & Nakagawa (1994):

where σ is the Stefan-Boltzmann constant and the viscous energy dissipation rate is:

for a Keplerian disk. For the ambient temperature due to stellar irradiation, we approximate:
![$T_{{\rm{surf}}}^4 \approx T_{\rm{*}}^4\left[ {{2 \over {3\pi }}{{\left( {{{{R_*}} \over r}} \right)}^3} + {1 \over 2}{{\left( {{{{R_*}} \over r}} \right)}^2}{{{H_{\rm{g}}}} \over r}\left( {{{{\rm{d}}\ln {H_g}} \over {{\rm{d}}\ln r}} - 1} \right)} \right] + T_{{\rm{irr}}}^4 + T_{{\rm{env}}}^4,$](/articles/aa/full_html/2022/10/aa43262-22/aa43262-22-eq10.png)
where we used d ln Hg / d ln r = 9/7 following Chiang & Goldreich (1997) as in Hueso & Guillot (2005). Furthermore, we used a background temperature Tenv = 10 K and a direct irradiation term stemming from radially illuminating the disk through the midplane  with the radial optical depth through the midplane τmid = ∫ρg,midκR(ρg,mid, Tmid)dr. Here and in Eq. (3), κP is the Planck mean opacity and κR is Rosseland’s mean opacity. Values for those opacities are used following Bell & Lin (1994), including interstellar dust and molecular contributions. In future works, we will couple the dust evolution module (Sect. 2.3) to the temperature structure. For this project, however, there is no feedback from those sub-modules onto the disk temperature or gas scale height.
2.2 Photoevaporation
2.2.1 Internal
The influence of high-energy radiation driving photoevaporation of the gas disk was taken into account with two prescriptions in this work: internal photoevaporation caused by the central star and external photoevaporation due to radiation from other stars (Sect. 2.2.2). For internal photoevaporation, we follow the prescription of Picogna et al. (2019), Ercolano et al. (2021), and Picogna et al. (2021). For this purpose, we need the stellar X-ray luminosity LX. The total mass-loss rate as a function of stellar luminosity is computed following Ercolano et al. (2021) and as a function of stellar mass following Picogna et al. (2021). The mass-loss profiles were obtained from Picogna et al. (2019, 2021).
To compute the total mass-loss rate as a function of a given stellar mass and X-ray luminosity, LX, we proceeded as follows. First, we determined the part of the luminosity that is in the soft X-ray band (0.1 to 1 keV), which controls the mass-loss rate (Ercolano et al. 2021). For this purpose, we performed a regression on the results of Ercolano et al. (2021), which gives:

The corresponding mass-loss rate for a 0.7 M⊙ star can be obtained using Eq. (5) of the same work,

where aS = −1.947 × 10¹⁷, bs = −1.572 × 10⁻⁴, cs = −2.866 × 10⁻¹, and dS = −6.694.
For the effect of the stellar mass on the mass-loss rate, we used the results of Picogna et al. (2021) and their Eq. (5), which gives:

To combine that with the stellar X-ray luminosity, we determined the equivalent X-ray luminosity for a 1 M⊙ star. For this we used the scaling of Güdel et al. (2007) so that:

The total mass-loss rate for our stellar mass is then:

where 1030.31 erg s−1 is the mean stellar X-ray luminosity of a 1M⊙ star following Güdel et al. (2007).
For the conversion into the surface density loss  , we used the fits to the same hydrodynamical simulations. All profiles have the same form:

where r10 = log10(r/1 au).
This profile was normalized such that the integral  corresponds to the total mass-loss rate
  . The coefficients for a 0.7 M⊙ star are given in Picogna et al. (2019), while those for 0.1, 0.3, 0.5, and 1.0 M⊙ stars are in Picogna et al. (2021). In the cases of stellar masses that were not modeled, we did not perform interpolation. Rather, we chose the closest stellar mass that was modeled and rounded toward lower stellar masses at mid distances, such that, for instance, the profile of a 0.2 M⊙ star is given by the parameter derived from the 0.1 M⊙ case. We note that, for this work, we restricted our analysis to 1M⊙ stars but for the sake of completeness, we give the stellar-mass dependency.
After an inner hole in the disk has opened, an additional transition disk evaporation is employed, yielding higher total mass-loss rates during this stage, where  is no longer reached due to already depleted regions of the disk. The total transitional mass-loss rate is given by:

and the profile is given by (Picogna et al. 2019):

where at = 0.11843, bt = 0.99695, ct = 0.14454, and x = (r − rh)/1 au with rh being the hole radius, meaning the radius where the integrated column density through the midplane reaches the maximum X-ray penetration depth of 1022 cm−2 (Owen et al. 2011a, 2012). A normalization factor is determined at the hole opening time to achieve a total mass-loss rate of  . The employed criterion for hole opening is r > 2.35 au (M*/1 M⊙) and, to prevent nonphysical evaporation, we restrict rh to be smaller than 120 au ×
  .
.
2.2.2 External
Using only internal XEUV evaporation produces “relic disks”, rings of gas outside of ~ 100 au that are not efficiently removed (Owen et al. 2011a, 2012). Such remnants are not observed but can be efficiently removed when considering external photoevaporation through far-ultraviolet (FUV) irradiation.
Incorporating a model for external photoevaporation that is based on the FUV Radiation Induced Evaporation of Discs grid (FRIED grid) from Haworth et al. (2018) enables us to model the external photoevaporation as a function of the local FUV field strength Ffuv1. For the implementation, we followed Weder et al. (in prep.). They use linear interpolation in the grid to retrieve mass-loss rates for given disk sizes and masses.
The outer radius of the disk has to be defined as the point where the disk transitions from optically thick to optically thin, and can be located by searching for the maximum mass-loss rate predicted from the FRIED grid for the outer disk region (see discussion in S20). 2D calculations from Haworth & Clarke (2019) show that the mass-loss rate is set entirely by the outer half of the disk and, for the most part, originates from the outer 10% of the disk. Therefore, mass is considered to be removed uniformly from the outer 10% of the disk (βext = 0.9), with Redge being the outer edge of the disk and  being the corresponding mass-loss rate retrieved from the FRIED grid.

It should be noted that, in order to avoid numerical problems, a smoothing was applied to the transition at βextRedge.
2.3 Dust evolution
We used the two-population model of dust evolution described in Birnstiel et al. (2012) to get surface densities of the monomer grains and of larger-sized pebbles. This approach is an approximation to the full size distribution of grains and pebbles in the disk. The lower size a0 represents the gas-coupled grains and the larger size a1 the drifting pebbles. Due to the fact that there would be a distribution of sizes, the typical size a1 is smaller than the maximum pebble size at a given location in the disk. For fragmentation-limited regions, they are smaller by a factor of fr = 0.37 and the typical size is given by:

where cs is the isothermal sound speed, ρs = 1 g cm−3 is the chosen grain density, and the vertical turbulence parameter at = a controls the settling of dust grains:

(Youdin & Lithwick 2007), as well as the relative velocities between grains (Ormel & Cuzzi 2007; Birnstiel et al. 2016). αt was set here to the same value as α, which drives the gas evolution of the disk. The last term, vfrag, is the collisional velocity at which icy grains fragment (e.g., Blum 2010). It was previously estimated to lie at 10 m/s, but could also lie an order of magnitude lower at 1 m s−1, as recently indicated by laboratory experiments (Gundlach et al. 2018; Musiolik & Wurm 2019; Steinpilz et al. 2019).
In the case of growth being limited by drift, the large grain size is given by:

where a second free parameter fd = 0.55 is fit to model outcomes (Birnstiel et al. 2012).
Birnstiel et al. (2012) further introduce a third parameter, fm, to relate the total surface density of all dust, ∑dust, to the surface densities of the two size bins as:


where fm is set to 0.97 or 0.75 in the drift or fragmentation-limited case, respectively.
The surface density of the two size bins is evolved as a combined advection and diffusion equation:
![${{{\rm{d}}{{\rm{\Sigma }}_{{\rm{dust}}}}} \over {{\rm{d}}t}} + {1 \over r}{\partial \over {\partial t}}\left[ {r\left( {{{\rm{\Sigma }}_{{\rm{dust}}}}\bar u - D{\partial \over {\partial r}}\left( {{{{{\rm{\Sigma }}_{{\rm{dust}}}}} \over {{{\rm{\Sigma }}_{\rm{g}}}}}} \right){{\rm{\Sigma }}_{\rm{g}}}} \right)} \right] = L,$](/articles/aa/full_html/2022/10/aa43262-22/aa43262-22-eq33.png)
where L can combine source or sink terms,  is the diffusion coefficient of the gas also used for particles here (as justified for small St, see Birnstiel et al. 2012), and the mass weighted velocity
  is given by:

 combines the velocities of the large and small grain populations with their velocities u0 and u1, given as the combined radial drift (azimuthal drag) and radial gas motion effects (Whipple 1972; Weidenschilling 1977; Nakagawa et al. 1986; Gárate et al. 2020).
In order to increase the precision of our prescription in regions with high dust-to-gas ratios, we include the feedback of the dust onto the gas velocity, and thus:

where we used the common definition of  . For simplicity, this reduced gas velocity is solely used for the dust evolution. Furthermore, we calculate the feedback coefficients assuming a mass-weighted, single dust size ā = (1 − fm(r))a0 + fm(r)a1, and thus Eqs. (29)-(30) from Gárate et al. (2020) can be used:


Here, and throughout this work, the Stokes number is calculated assuming the Epstein regime  , where a is either a mean or a distinct size of the two size bins. With the reduced radial gas velocity from Eq. (22), the drift velocity of the two dust sizes used in Eq. (21) can be calculated following Nakagawa et al. (1986):

Differing from the original Birnstiel et al. (2012) model, we include the factor  following Nakagawa et al. (1986), which reduces radial drift if dust midplane densities ρd,mid become comparable to the gas midplane density ρg,mid. For this consideration, the dust midplane density is calculated assuming a Gaussian profile with a scale height of Hd (Eq. (16)) and a single mass-averaged size ā.
2.4 Dust disk clearing by entrainment in photoevaporative winds
This main model for the dust evolution was extended to account for a more realistic treatment in regions where the gaseous disk disperses. There, entrainment of dust grains in photoevaporative winds and radiation pressure on the grains (Sect. 2.5) can become relevant. A variation to the model assuming settled dust with no vertical dust flux, in the following called the “settling” model, is described in Appendix A.
Wherever photoevaporative winds launch gas from the disk surface, dust particles can be entrained in the wind (Facchini et al. 2016; Hutchison et al. 2016; Franz et al. 2020). Given a local gas surface density removal rate of  , the drag force in the Epstein regime on a spherical dust particle is:

where vth is the thermal velocity of the gas in this wind, and we followed S20 in describing the radial velocity of the wind  with a geometric factor
  . The tem-peratures used to calculate the thermal velocity of the winds are 1000 K (Matsuyama et al. 2003) for external photoevaporation and 2000 K for internal XEUV photoevaporation (Picogna et al. 2019). For a stationary grain, we can equate this drag force to the gravitational pull of the star to derive a critical size of:

This size limit is applicable for a nonmoving particle, and thus for externally launched winds. For a given size distribution of the dust n(a) ∝ aq, where we assume q = −3.5 (Dohnanyi 1969; Birnstiel et al. 2016) and a size-independent dust bulk density ρs, it is possible to calculate the mass fraction of entrained particles2:

The local change in dust surface density is then given by:

where δdg is the dust-to-gas ratio.
For internal photoevaporation, Booth & Clarke (2021) derived a more constraining limit by taking into account vertical advection of dust grains from the midplane to the base of the flow. In this scenario, the strongest limitation on the maximum dust size that can be entrained originates from whether a grain can be lifted to the region just below the ionization front, which marks the base layer of an evaporative flow driven by XEUV radiation. We include the following advection-related limit whenever we consider internal photoevaporation:

Here, we approximated Hbase ≈ Hg, which holds for a vertically isothermal disk. Furthermore, we used zbase/Hbase = 4 as suggested by Booth & Clarke (2021).
Overall, our implementation of dust entrainment follows S20 for external photoevaporation, and the suggested prescription of Booth & Clarke (2021) for internal photoevaporation. Lastly, it is not physically possible to entrain dust where no gas is left. Therefore, we check that the gas evaporation rate cannot exceed the amount of local gas surface density multiplied by the timestep. This is in fact not always strictly true in evolving numerical models with finite sized time steps. Given a cell in which little gas was left, gas could diffuse into it during one time step, which would, in principle, allow for more entrainment, which is now suppressed.
2.5 Radiation pressure effects
Typically, once the gas disk clears, remaining dust grains are exposed to direct irradiation from the star. The radiation pressure force acting on a spherical grain with surface area A, assuming perfect absorption (neglecting in particular Mie scattering) in the radial direction, is:

where L* is the stellar luminosity and c is the speed of light in vacuum. Due to the identical scaling with 1/r2, the force can be related to the gravitational force by defining (e.g., Burns et al. 1979; Grün et al. 1985):

for a spherical particle with radius a and density ρs. This can then be used to modify the gravitational potential of the star  . Escape of a particle from the system occurs if the total energy E/m = v2/2 + U′ > 0. In the case of a particle that was on a circular, Keplerian orbit (v = vK) before being irradiated, this leads to the condition
  (e.g., Burns et al. 1979; Klahr & Lin 2001, and references therein). Therefore, particles below a critical size of:

are ejected from the system once radiation reaches them. Analogous to Eq. (28), a fraction of the local dust can be removed. For radiation pressure, which mainly acts after the gas disk has dissipated, it is appropriate to assume q = −3.5, the collision-dominated size slope (e.g., Dohnanyi 1969). Modifications to this classical result would be more likely to arise in the presence of gas where particles drift (Birnstiel et al. 2011), and not in the gas-free, debris disk environment.
The aforementioned fraction of dust is removed either on an orbital timescale or during one collisional timescale in the Brownian motion regime (Birnstiel et al. 2016):

where ρd is the volume mass density of dust distributed in the disk, in contrast to the bulk density of the dust particles ρs. We used this timescale as the duration it takes to reestablish a collisional cascade size distribution after removing small particles for the case of a1 > acrit, wherever it is longer than an orbital timescale.
To account for shielding of the disk, we calculated the optical depth τmid,dust along a straight light ray through the midplane using the amount of dust in the small size bin given by the two-population model3. The opacity of this micrometer dust follows Bell & Lin (1994) and we assumed that the dust disk has a scale height of 0.04 for this calculation (following the estimation of Thébault 2009, for debris disks). The amount of material that is removed is then reduced by the factor:

This includes some radiation that can reach a razor-thin disk from the surface due to the geometrical extent of the star  . This way of accounting for shielding assumes that the photons that reach the dust still carry their full energy but that not all the dust is affected immediately. We note that during the gas disk stage, most of the disk is shielded from radiation through the midplane. Nevertheless, the innermost cells can be influenced and we allowed for radiation-related effects also during the gas disk stage using the assumptions noted here (constant disk scale height, fragmentation-dominated size distribution).
In addition to the aforementioned possibility of reaching hyperbolic orbits due to radiation pressure, Poynting-Robertson drag influences the dust particles (Robertson & Russell 1937). In the rest frame of the Sun, this effect can be seen to be caused by the wavelength difference of emitted radiation by a moving particle (Burns et al. 1979). This leads to a decrease in the eccentricities and semimajor axes of irradiated bodies with radii a > acrit.
Considering that eccentricities were damped in the gaseous disk very quickly and cannot be efficiently increased by radiation pressure for large particles, we set the eccentricity to zero. Thus, the rate of increase of distance to the star as a result of Poynting–Robertson drag for circular orbits is given by (see e.g., Wyatt & Whipple 1950; Burns et al. 1979; Kobayashi et al. 2009, for derivations):

which is added to u0 and u1 in Eq. (21). We note that we reduced the velocity by fred to account for optical shielding that makes the process inefficient in optically thick regions.
This simple approach to model Poynting-Robertson drag and radiation pressure neglects both stellar winds and the wavelength dependency of the absorption. For particles of comparable size to the typical wavelength of the radiation ~0.1 µm, Mie scattering would occur. However, for those particles, collisions with radially outward-moving stellar-wind particles becomes important, which also leads to ejection (Burns et al. 1979).
In the absence of gas, the collisional growth prescription also needs to be adapted. As Brownian motion can be assumed to dominate the relative velocities, the collisional timescale assuming a size a for all grains is again given by Eq. (34). Assuming that the mass doubles each time two particles meet, this growth timescale leads to a size increase:

which we use to evolve the larger representative size a1, assuming here no radial mixing or drift after the gas has locally disappeared (see Sect. 4.2.1).
Disk parameters.
2.6 Model setup
An important step is how to initialize the simulations. The starting point of the gas disk is an arbitrary time with an initial surface density profile following Eq. (1). For our calculations, we used the disk parameters listed in Table 1. However, immediately after initialization the gas disk is not in a steady state. It will evolve on a short timescale until sink terms in Eq. (2) are balanced and the disk reaches a quasi-equilibrium. Given the dependency on initial parameters, we do not yet insert the solids and start their evolution during this stage. Instead, we track the outermost cell with Σg ≠ 0. Once it moves less than 5 % in the last 1000 yr of simulation time, we consider the disk equilibrated. After this stage is reached, we multiply the gas surface density by a constant dust-to-gas ratio (Table 1), which results in an initial dust surface density. For further discussion, we set our time zero to the time at which this happens. The delay of the solid evolution compared to the gas disk, as well as the initial solid disk masses, are listed in Table 2. We note that it is not possible to find an equilibrium for values of Ffuv or that are too large, or viscosities that are too low. This limits the explorable range of parameters and when testing increased values of Ffuv, we chose 7000 G0, where an equilibrium is still reached.
Gas disk equilibration times and initial solid disk masses.
3 Results
3.1 Model comparison
3.1.1 The magnitude of dust entrainment
For the disk parameters given in Table 1, we compare here, and in the following section, the evolution models for dust entrainment and radiation pressure effects described in Sects. 2.4 and 2.5, respectively. The chosen nominal values are realistic starting points (e.g., Tobin et al. 2020) but are arbitrarily chosen for the sake of visualizing the different processes. The nominal external UV field strength Ffuv causing external photoevaporation is on the stronger side, and should therefore allow for a comparison of the dust entrainment in the evaporated gas for the different models.
Comparing, in Fig. 1, the dotted red line for the case without any dust entrainment to the nominal model, we see that dust entrainment can become an important effect in the later stages for the overall mass budget. Several Earth masses of dust can be carried away by the photoevaporative wind. Furthermore, we find that assuming the dust to be settled without the possibility of advection to the base layers reduces the entrained mass by an order of magnitude.
We further stress that the ~3 M⊕ of dust, which is entrained in winds in the nominal case, does not necessarily decrease the disk mass by this amount at a given time. Instead, less mass is accreted onto the star and the disk mass differs by a few tenths of an Earth mass.
In the radial evaporation profiles shown in the third panels of Figs. 2-3, we split up the contributions of internally and externally driven photoevaporation for the nominal model (for the settling model, only external photoevaporation is relevant, see below). The entrainment rates due to external photoevaporation are orders of magnitude larger than the rates due to internal photoevaporation. The reason becomes clear from the fourth panel in Fig. 2, which shows the size limits aent,int and aent,ext compared to the shaded region spanning over the size distribution of grains in the disk. aent,ext lies above the largest sizes of dust in the disk, meaning the full size distribution can be entrained. Early on, this is because dust had not yet had the time to grow. Later on, the drop in surface density leads to a steepening pressure gradient, which in turn lowers the drift limit (Eq. (17)) to retain only small dust (Fig. 3). For these reasons the whole size distribution falls below aent,ext for our nominal disk parameters shown here, and the full dust content can be entrained in the flow ( ).
).
In contrast, aent,int barely reaches our chosen monomer grain size of 1 × 10⁻⁵ cm. In this case, fent is small (Eq. (28)) and suppresses entrainment to a large degree. However, it is not zero, which will lead to some dust entrainment. At radii smaller than approximately 4 au, aent,int falls below the monomer size and no dust is entrained anymore.
We note that in a test without the advection limit of Booth & Clarke (2021) and using the aent,ext limit (Eq. (27)) for internal photoevaporation instead, we found the entrained mass in internally driven photoevaporative flows to be much lower than in externally driven ones. This is in part due to our choice of parameters (a relatively low Lx and a large Ffuv, see Sect. 4.1), and is further facilitated by the much larger area that is covered by external photoevaporation (not well visualized in a radially logarithmic plot).
For the case of a disk with settling and without vertical dust advection (described in Appendix A), we find that dust is entrained in the evaporative flow only where external photoevaporation is acting. At early times, zbase approaches the midplane in this region. This can only occur if ΣgΩK becomes similar to  (i.e., the mass-loss prescription implies mass loss over a dynamical time), which is only the case in the outermost region of the disk where the profile falls off exponentially. For the more evolved disk shown in Fig. 3, it is even rarer. Only a single numerical cell has a dust entrainment rate sufficient to appear on the chart. Everywhere else, dust entrainment is negligible. In this settling description, we find that dust settles in such a way that it can be described with a scale height of a few tenths of the gas scale height for the large particles (Fromang & Nelson 2009), and ~ 1 gas scale height for the small dust, while the base layer of the evaporative flow zbase lies at ~5 gas scale heights in the disk region where internal photoevaporation is effective. This explains the almost full suppression in the settling model case.
Recently, Franz et al. (2022a) also assumed that particles remain settled toward the midplane. They used two-dimensional (r, z) maps of disks undergoing internal XEUV-driven photoevaporation (Picogna et al. 2019) and inserted Lagrangian particles that they could track. The entrainment rates found would amount to a few Earth masses of dust being lost in total. This shows that, in principle, internal evaporation can also lead to significant entrainment of dust under the settling assumption. However, their initial disk size is considerably larger than our disk, which is truncated by external evaporation. The r-dependent entrainment rates found by Franz et al. (2022a) drop to zero within a few tens of astronomical units, consistent with our work. Furthermore, the choice of the assumed lower limit of the size distribution amin influences the results. In our nominal scenario, we used amin = 0.1 µm, whereas the distribution of Franz et al. (2022a) extends to grains that are an order of magnitude smaller. We discuss the influence of «min in Sect. 3.2.4.
Furthermore, the critical entrained sizes aent,int that we derive with our analytic approach for the internal photoevaporation can be compared to more detailed models. Owen et al. (2011b), Hutchison et al. (2016), and Franz et al. (2020) found critical sizes ranging from 1µm–10µm. Those lie above our limiting size because we consider the advection limit of Booth & Clarke (2021). Without this, we would recover similar values. For external photoevaporation, larger grains can be entrained due to the increased evaporation rates based on the FRIED grid and the larger distance to the star. Toward the outer edge, where gas densities are low, the critical size calculated using the midplane condition reaches, in the early stages of the disk evolution, up to ~0.1 cm.
We further note that entrainment results would change if we did insert the dust together with the gas, instead of waiting for equilibration of viscous spreading and disk truncation due to external photoevaporation (Sect. 2.6). In that case, more of the initially placed dust would be entrained.
Here, we have demonstrated that for a disk extending all the way to the star, internal photoevaporation is not efficient at entraining dust, neither under the settling nor under the advection assumption. However, the picture would change if we increased the X-ray luminosity (see Sect. 3.2.2), or for a disk with a cavity. In such a case, as we further discuss in Sect. 4.2.3, radiation can reach the cavity edge and could remove particles at this location (Owen & Kollmeier 2019). Our model, in that case, is incomplete as it considers all the dust to be at least partially shielded from radiation, as long as gas is present. Furthermore, with the nominal high turbulent α value and moderate X-ray luminosity Lx parameters chosen, no inner disk cavity can open.
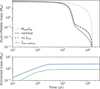 |
Fig. 1 Dust and pebble mass evolution for different dust entrainment models. The top panel shows the mass content at a given time after the start of the solid evolution, while the lower panel shows the cumulative mass entrained in evaporative winds. Different calculations are shown for the nominal dust entrainment model (thick blue line), a model without any dust entrainment (dotted red line), and the model with settled dust (dashed green line, see Appendix A). |
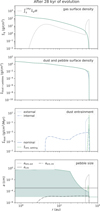 |
Fig. 2 Snapshot of the gas and dust disk after 10kyr of solid evolution for the nominal and the settling models. The two upper panels show the surface density of gas (identical for both cases), and combined dust and pebbles, the third panel shows the dust and pebble removal rate, and the bottom panel shows the typical pebble size a1. The shaded region spans from the monomer grain size to a1. In addition to the two different entrainment models, we also show critical entrainment sizes at the midplane (bottom panel) and the integrated gas photoevaporation rate (top panel) according to the legends in the upper left corners. |
3.1.2 The importance of Poynting–Robertson drag
In order to study the effects of Poynting–Robertson drag and radiation pressure ejecting dust grains, we change the settings from the tests above. Here, we ignore all kinds of entrainment in photoevaporative winds and reduce the fragmentation velocity to 100 cm s−1. This value is one order of magnitude lower than the nominal setting but still reasonable (Steinpilz et al. 2019). These changes to the model are made in order to be left with a significant dust and pebble disk once the gas has cleared. In particular, the lowered fragmentation threshold suppresses growth and drift of pebbles. Thus, 24 M⊕ out of an initial 42.5 M⊕ of small dust is present when radiation from the central star starts to reach dust in our model. In this way, we can test the processes related to radiation pressure, namely Poynting-Robertson drag (Eq. (36)) and ejection of grains with sizes a < acrit (Eq. (33)) by radiation pressure.
In Fig. 4, the gas disk dispersal is marked by the thin gray line – showing the gas disk mass multiplied by the assumed dust-togas ratio δdg – dropping to zero at 1.43 Myr. Subsequently, the disk made of dust and pebbles remains present up to ~200 Myr. During this time, using the nominal model, dust is both ejected by radiation pressure (5 M⊕) and accreted onto the star (another 19 M⊕ in addition to the 18 M⊕ that were already accreted during the gas stage). In contrast, if Poynting–Robertson drag is disabled, very little mass is ejected or accreted.
These results demonstrate the interplay of both radiation-related effects. Without Poynting–Robertson drag moving dust grains toward the star, very little mass is ejected. This can be attributed, in our simple model, to the long collisional timescale in the cold and low-density (small T and ρd in Eq. (34)) outer disk. For a massive remnant dust disk, particles generally grow to sizes larger than the critical size everywhere in the disk. Thereafter, only the fraction of the size distribution below acrit can be removed and needs to be replenished by further collisions. If these collisions do not happen frequently enough, only very little mass will be ejected from the system. For the case without Poynting–Robertson drag, shown as the gray line in Fig. 4, we find significant ejection of grains out to about 5 au only. Another factor is the stellar evolution (Baraffe et al. 2015), which leads to a reduction of Lstar over timescales ~1 × 10⁸ yr. Thus, acrit further decreases and a smaller fraction of the dust can be removed at later times.
For these relatively massive dust disks, a similar behavior of the mass evolution is recovered if only Poynting–Robertson drag is included and direct ejection of grains is neglected. However, the amount of accreted mass onto the star will be overestimated because all the mass accretes onto the star instead of a fraction being ejected. This might slightly influence measured stellar metallicities. Nevertheless, to first order, it is more relevant to consider Poynting–Robertson drag compared to direct ejection of grains.
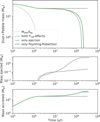 |
Fig. 4 Long-term dust and pebble disk mass evolution (top), as well as dust mass ejected due to radiation pressure (middle) and accreted onto the star (bottom). All models start with a low vfrag of 1 × 10⁻² cm s−1 and do not include the effect of dust entrainment in photoevaporative winds. The thick gray line denotes the model without Poynting–Robertson drag but with direct ejection of the smallest grains due to radiation pressure. The inverted assumptions are shown with a green line. The nominal model (dotted black line) includes both effects and is equivalent to the low-vftag case shown in the top row of Fig. 5. |
3.2 Influence of model parameters
After analyzing the relevance of radiation pressure and dust entrainment in photoevaporative winds for nominal parameters, we explore the dependence on such parameters using a grid of values. We modify the parameters indicated in Table 1 generally by one order of magnitude, to higher or lower values. For FfuV, where an increase of an order of magnitude is not possible, we chose 7000 G0 instead, and we chose 0.7 and 1.2 for the lower and higher variations of βg. The results are presented in Fig. 5.
3.2.1 Initial disk
We varied the gas disk mass, the exponential cut-off radius, and the slope of the gas disk, and show the results in the middle row of panels in Fig. 5. For variations of the profile, the disk mass was kept the same. Changing the slope or increasing the outer radius did not significantly influence the results. This is mainly because the gas disk evolves to a very similar state before we start the solid evolution.
For smaller initial disks, less dust is located in the outer regions where it can be removed. This was not fully balanced by the initial 13 kyr stage of viscous spreading.
Varying the total disk mass considerably changes the amount of dust that can be entrained. While an order of magnitude change could be expected from the initial solid content, the larger disk with a gas mass of 0.12M⊙ and a solid content of 456.8 M⊕, instead of 0.012M⊙ and 42.5M⊕, results in sixteen times more dust entrainment (40.1M⊕ of dust, or 8.8 % of the initial solid mass). Similar to the results in Sect. 3.1.1, dust is mainly removed due to externally induced winds. For a more massive disk, the surface area subject to external photoevaporation is increased because its viscous spreading balances evaporation at ~80au, compared to 60 au for the nominal disk. Therefore, more mass is removed and critical entrainment sizes are larger. These effects enhance entrainment in a superlinear fashion for more extended disks.
3.2.2 Photoevaporation parameters
Both LX and FfuV regulate the strength of disk photoevaporation. Increasing those values reduces the gaseous disk lifetime, and therefore accelerates the overall evolution. Lowering or increasing external evaporation by the amount listed in Table 1 changes the lifetime of the gas disk by about 1 Myr. A similar outcome is found when modifying LX, although a small gas disk is present for ~4 Myr with a low LX of 1 × 1028 erg s−1.
Using the nominal model, dust is mainly entrained in external photoevaporative winds (see Sect. 3.1.1). Thus, the variation of the parameter responsible for the internal photoevaporation, Lx, barely changes the amount of entrained dust. However, for variations in the external parameter FfuV, significant differences can be seen when lowering the field strength to 100 G0. In this case, the dust mass that is entrained is reduced. Perhaps less expected is that an increase in the external UV field does not automatically lead to a larger entrained dust mass. This is because the disk initially shrinks to a smaller size (~35 au), which then reduces the area that is subjected to external photoevaporation. As external photoevaporation dominates in all cases studied here, we continue the discussion for reduced FfuV and increased Lx in Sect. 4.1.
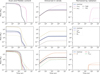 |
Fig. 5 Dust and pebble mass evolution for different parameters. The dashed (dotted) line corresponds to enlarged (lowered) values by the variation indicated in Table 1. All simulations were performed using the nominal dust photoevaporation model and including removal and Poynting–Robertson drag of dust due to radiation pressure. The top row shows the influence of dust-evolution parameters, the middle row shows results for varied initial disk conditions, and the bottom row shows simulations with different gas-evolution parameters. For several parameters, radiation-removed masses lie below 1 × 10⁻² M⊕ and are, therefore, not visible. |
3.2.3 Fragmentation velocity vfrag
A change to vfrag affects the local maximum size of the pebbles as  if fragmentation limits growth (Eq. (15)), which is the case in the inner disk (Birnstiel et al. 2016). For the same gas disk, we can see in Fig. 5 that less dust and fewer pebbles are present in the first few hundred kyr for a higher vfrag (dashed pink line). This is the stage where the front at which pebbles reach large stokes numbers is in the region of the disk where growth is limited by fragmentation. Therefore, an increased vfrag directly translates to larger pebbles. They in turn drift faster and pile up at the inner edge. It is worth pointing out that we chose not to include pebble accretion onto planets (Ormel & Klahr 2010), nor the formation of planetesimals out of the pebble flux (e.g., Lenz et al. 2019). Without those processes and without pressure bumps, pebbles are free to drift to the single pressure maximum close to the inner edge of the disk.
Due to this accumulation, the surface density of dust and pebbles can locally approach and even surpass the surface density of gas, and radial drift becomes suppressed (Eq. (25), see also Nakagawa et al. 1986). Nevertheless, the combination of diffusion of particles and advection with the gas as well as Poynting–Robertson drift and ejection of grains in the innermost region where radiation can reach, leads to the slow removal of the reservoir of drifted pebbles. This removal of the inner disk is, however, slower if larger sizes are reached. Thus, in the top left panel of Fig. 5, we can see that the dust mass in the nominal case drops below the high-vfrag case after a while. We note that in this case, with a large accumulation of pebbles in the innermost region, we would expect streaming instabilities (Johansen et al. 2007; Klahr & Schreiber 2020, Klahr & Schreiber 2021) to occur and potentially trigger the collapse of clumps of dust (Gerbig et al. 2020), which is not included in our simulations but will be added in the future.
The optical thickness gradually decreases with time, which allows for a larger region to be radiated as the disk thins out. Thus, the inner dust disk can be removed by radiation pressure thanks to short fragmentation timescales, despite the increased particles sizes. We recall that we remove small dust on the longer timescale, out of the fragmentation and orbital timescales. In the inner disk, where the dust is deposited in this high-vfrag scenario, both are short. Furthermore, particles can still be accreted onto the star due to Poynting–Robertson drag. Those effects become important during the later stages of the gas disk evolution and lead to a removal of the dust disk, together with the gas.
For low values of vfrag, which were recently favored by laboratory experiments (Steinpilz et al. 2019; Gundlach et al. 2018; Musiolik & Wurm 2019; see also Pinilla et al. 20214 ), we see less depletion of dust and pebbles in the initial stages. Indeed, for the nominal choice of the rest of the parameters (see Table 1), a vfrag of 100 cm s−1 results in a maximum grain size at any location in the disk below 0.01 cm. Small grains such as this essentially follow the gas - with one important exception: they still settle to regions closer to the midplane. However, with vertical dust advection, they are easily transported to the upper layers, and therefore are still entrained in the photoevaporative wind in our nominal entrainment model.
Due to the small size of the particles for low vfrag, radial drift is suppressed. Therefore, mass remains in the outer disk, where it is entrained by photoevaporation, for a longer time. Thus, entrainment becomes the dominating dust removal effect. The suppression of drift also leaves a larger reservoir of dust after the gas disk has dissipated. Therefore, a light remnant disk of dust (~0.05 M⊕) is cleared by radiation pressure in this scenario, which is an order of magnitude more than in the nominal case. We note that for the low-vfrag case but with the settling model instead, we would be left with a much larger remnant almost identical to the test case presented in Sect. 3.1.1.
3.2.4 Dust monomer size amin
The minimum size of grains is expected to be inherited from the interstellar material with sizes ranging from 0.01 m to 1 m (Mathis et al. 1977), which are the two limits we explore in addition to the nominal value of 0.1 µm. We find a moderate impact of the initial monomer size on dust entrainment in photoevaporative winds. The entrained mass varies by a factor of ~1.5 for order of magnitude changes in amin. As discussed in Sect. 3.1, the whole size distribution is usually entrained in the externally photoevaporated part of the disk, which makes the smallest size irrelevant. However, the magnitude of internal photoevaporation is affected and leads to the aforementioned change. For the high minimum size of 1 m, no dust is entrained in internally induced photoevaporative winds as this lies above the aent,int limit of Booth & Clarke (2021) for the nominal X-ray luminosity (but see also the discussion in Sect. 4.1).
3.2.5 Viscous a
The interpretation of the effect of the viscous a is more challenging as many aspects depend on it. First, lowering (increasing) a has a similar effect on the dust evolution as an increased (decreased) vfrag: it changes the maximum size of pebbles due to fragmentation (a1 ∝ α−1). Similar to the case discussed above, the maximum grain size for high a values remains below a few hundred m. However, Fig. 5 shows that for high a, the overall evolution is faster, which is due to the faster gas disk evolution; the gas disk has disappeared after ~200 kyr. Overall, a very similar amount of dust has been entrained in the high-a case as for low vfrag, but on a shorter timescale.
We note that settling would also be influenced for such high values of a. Therefore, we found in a test run with the settling model, which ignores vertical dust advection (Appendix A), that a similar amount of dust is entrained as for the nominal model. This can be attributed to the vigorous turbulence combined with the small grain size increasing the scale height of dust (Eq. (A.3)). Given the current lack of clear mechanisms driving turbulence in disks, it is possible that a is not constant in time. Therefore, it is important to mention that dust entrainment is already a relevant sink of dust mass if a is on the order of 1 × 10⁻² for a duration of ~ 100 kyr. It does not have to remain at this value during the full several Myr of typical disk lifetimes (Haisch et al. 2001; Richert et al. 2018; Michel et al. 2021).
Lowering a to 3.16 × 10⁻⁴ is motivated by recent findings: observational (e.g., Flaherty et al. 2017, but see also Dullemond et al. 2018; Rosotti et al. 2020) and theoretical arguments for low values were put forward in recent years (Bai & Stone 2013; Klahr & Hubbard 2014). In that case, pebbles can grow similar to the high-vfrag scenario. The most considerable fraction of solids grow, drift, and pile up at the disk inner edge, and would have been available for planetesimal formation or pebble accretion on the way there.
Again, similar to the high-vfrag case is the dispersal of the inner dust and pebbles due to radiation pressure and accretion onto the star, driven by the Poynting–Robertson effect. The difference is that less dust piles up; thus this mechanism is less pronounced.
We further note that the low value of a reduces the amount of gas that is accreted onto the star, and therefore it fails to meet the available observational constraints on accretion rates in young clusters (Alcalá et al. 2014, 2017; Manara et al. 2016, 2017, 2020). Here, we do not yet include magnetized winds (Bai et al. 2016) driving accretion onto the star, which could resolve this issue and should be explored in the context of dust entrainment in the future.
4 Discussion
4.1 Entrainment in internally driven wind
Here, we want to put into perspective our finding that dust is mainly entrained in externally driven photoevaporative winds and not in winds caused by XEUV radiation as described in Picogna et al. (2019), Picogna et al. (2021), and Ercolano et al. (2021). This conclusion is somewhat warped because our nominal parameters contain a relatively weak X-ray luminosity of 1 × 1029 erg s−1 but a strong FUV field strength of 1000 G0 (see e.g., Adams 2010). The former value is more than an order of magnitude lower than the values observed by Güdel et al. (2007) for solar-mass stars. In contrast, FUV field strengths can be much lower than our chosen nominal values if no massive O- or early B-star is present in the vicinity. This is the case for several star forming regions that are observable today (see e.g., the discussion in Sect. 5.5. of Michel et al. 2021). For these reasons, we additionally explore here the case of a disk with negligible external photoevaporation but stronger internal photoevaporation.
As we show in Fig. 6, it is not at all clear that external evaporation needs to drive a larger dust mass loss compared to internal photoevaporation. For reasonable values of LX ~ 1 × 1030 erg s−1, we find a comparable mass loss as in the mainly externally driven nominal case. An even larger amount can be entrained when the X-ray luminosity is further increased to 1 × 1031 erg s−1 . Interestingly, in this case we obtain a ring feature in the dust at 10 au, which survives the gas phase. It emerges due to a bump in the XEUV photoevaporation profile of Picogna et al. (2021) at this location. This dust is then removed by radiation pressure. Such a feature is not present for the lower luminosities.
The results shown here highlight that both internal and external photoevaporation can drive significant dust mass losses. Both drivers can dominate for reasonable choices of X-ray luminosities or external field strengths. Depending on the level of extinction of external radiation (see also Cleeves et al. 2016), it is possible that internally driven fields dominate also for a more general case, rather than only in regions without massive stars.
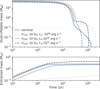 |
Fig. 6 Dust and pebble mass (top) and cumulative entrained mass (bottom) evolution for different X-ray luminosities. LX controls the strength of internally driven photoevaporation in our prescription from Picogna et al. (2021). Except for the nominal case, we use reduced FFUV. |
4.2 Caveats
4.2.1 Limitations of the two-population approach
In order to have a model for which the computation time is short enough to use it in population synthesis models, we chose the two-population approach to dust evolution of Birnstiel et al. (2012). However, there exist some shortcomings compared to a full dust growth and collision model (e.g., Birnstiel et al. 2010). For our application, the most relevant shortcoming is the assumption that gas is always the dominant constituent in the disk. We improved on this and introduced in Sect. 2.5 a regime where Brownian motion and Poynting–Robertson drag replace the collision timescale and the drift velocity. Furthermore, we included the prescriptions of Nakagawa et al. (1986) and Gárate et al. (2020) to smoothly reduce radial drift velocities as gas densities reduce, and dust starts to dominate and affect the gas.
However, while dust velocities are adjusted consistently, we did not yet include a consistent model for dust sizes. The fragmentation-limited maximum size is proportional to ∑g and the drift limit depends on the gaseous pressure gradient. Therefore, for fragmentation-dominated regions, the size reduces as the gas surface density reduces (keeping the Stokes number constant). Also, in the drift-limited case (in the outer region), dust sizes decrease as the gaseous disk shrinks and the pressure gradient steepens toward the outer edge. We stop following this reduction of the representative larger size a1 as soon as gas midplane densities fall below dust midplane densities. This is certainly a threshold where the assumption of gas-dominated evolution fails. However, even before that, it remains to be checked if collisions are frequent enough to grind the pebbles into dust in regions where gas densities are low. Similarly, we do not check if the drift timescale is short enough to allow for the size reduction that we find toward the outer edge. Since gas evaporation can be relatively quick in regions of low surface densities at a few astronomical units, the sizes might instead be frozen earlier. A comparison to the results of a full dust growth and collision model (using dustpy, Gárate et al., in prep.) will shed light on whether this assumption was warranted.
On a similar note, the implementation of Poynting–Robertson-dragged dust is not completely consistent. This is because as particles drift, the two-population approach assumes that they encounter other particles and reach an equilibrium size distribution at the new location. For gas dominated disks, this has been verified and is a reasonable assumption (Birnstiel et al. 2012). However, for the case of pure dust disks, collisions are rarer and more gentle, potentially allowing for the preservation of the size of a drifting body, or even growth. Here, we do not find any prominent radial motion due to Poynting–Robertson drag. Therefore, this is not a major drawback, but the size evolution should be revised for studies of debris disks or other massive dust disks without gas.
4.2.2 Dust feedback on photoevaporation
We also note that the entrained dust would influence the photoevaporation rate (Facchini et al. 2016), which is not taken into account in our model. While the analytical work of Facchini et al. (2016) sheds some light on these questions, it would be highly useful to run numerical simulations of multidimensional disks subject to external photoevaporation including embedded dust particles, similar to the works of Hutchison et al. (2016), Franz et al. (2020), and Franz et al. (2022a), which address pure internal evaporation. For internal photoevaporation, Franz et al. (2022b) found potentially observable cone or chimney-like features, which are more pronounced if the dust is considered as settled. Thus, observations in scattered and polarized light will also help to answer those questions.
4.2.3 Owen & Kollmeier (2019) mechanism: Radiation pressure effects in gas-rich disks
Recently, Owen & Kollmeier (2019) proposed a novel mechanism for clearing dust from a disk still containing gas with an inner 10 au cavity. Radiation pressure can remove dust above the disk photosphere, and therefore clear dust more quickly than gas. The process requires small grains to be reproduced by fragmentation and is generally not efficient for the overall disk (Takeuchi & Lin 2003). However, for the case of a pressure trap where the surface density of dust is significantly enhanced, collisional grinding is faster and the dust densities at all heights are enlarged. For disks with large external photoevaporation, which are the main focus of this work, the scenario is not relevant. This is because there is no stage where an extended 10 au cavity opens.
However, for the future development of a model that is applicable for population synthesis where disks with low Ffuv values also need to be explored, the mechanism should be included. As stated by Owen & Kollmeier (2019), the difficulty lies in the coupled problem of the dust evolution influencing the opacity of the disk, which in turn is very crucial for determining the photosphere and how much dust lies above it. In general, such a coupling of dust evolution to opacities leads to interesting effects that should be further explored (Savvidou et al. 2020).
5 Summary and conclusions
In order to better compare models of disk evolution and planet formation to observations, we present an improved description of dust and pebble evolution in the two-population approach that is better applicable to disks that become gas depleted. The model includes dust entrainment in photoevaporative winds under the consideration that larger dust is mostly settled to the midplane, but dust below a critical size can be transported to the upper layers of the disk. The adopted prescription for internally driven photoevaporation by Booth & Clarke (2021) is, for the first time, used in global models, while treatment of entrainment in externally driven winds is identical to the approach presented in S20. Where applicable, the limit of Booth & Clarke (2021) gives slightly smaller entrainment sizes compared to what was found by Franz et al. (2020), Franz et al. (2022a), and Gárate et al. (2021) showing the importance of this effect. Furthermore, we include direct ejection of grains and Poynting–Robertson drag caused by radiation pressure of the central star once the disk becomes optically thin, which will be useful for studying the fate of second generation dust (Gerbig et al. 2019) in the future.
In this first paper of a series working toward a population synthesis of protoplanetary disks, we vary model assumptions, parameters, and initial conditions to study their effects on the disk mass budget and radial profile. We find:
For internal photoevaporation, the base of the evaporative flow lies an order of magnitude higher than dust scale heights obtained under the assumption that dust settles and no vertical dust advection occurs. Therefore, this layer would be dust-depleted without vertical advection of small grains. Consequently, the ability to advect small grains typically limits entrainment rates (in agreement with Booth & Clarke 2021).
Due to the geometry of externally driven flows, we assume that grains can be entrained from the full vertical extent of the disk. We find that for nominal disk parameters, about 5 % of the solid mass can be lost to externally induced flows.
More dust can be entrained if the disk is more massive (~9 % for a 0.12 M⊕ disk) or if particles remain smaller due to turbulence or lower fragmentation velocities. For a viscous α = 3.16 × 10⁻² or a vfrag = 1 m s−1, a total of ~50 % of dust is entrained in the evaporative flow. In these cases, grains are not drifting toward the star and become entrained in the photoevaporative flow instead.
For our fiducial parameters, more dust is entrained in externally driven winds. However, if field strengths are reduced, as in several star forming regions observable today, entrainment in internally driven winds can also dominate and entrain a similar amount of dust.
Nominally, dust follows the gas and is removed as the gas disk disappears. This is only possible thanks to the included vertical transport of small grains. If this is suppressed, or if second generation dust forms, we find that a massive debris disk can survive up to 100 Myr. In this later stage, Poynting–Robertson drag is crucial to move dust toward the star where it can more easily be removed.
With this work, we present an important step to pave the way for global models of planet formation to include a more realistic treatment of dust. Detailed emission modeling and comparisons to ALMA data will further constrain the nature of the protoplanetary disks in which planets form. Furthermore, when including forming planets and their feedback on the dust disk, we will learn about planet formation as it is happening right now.
Acknowledgements
We thank T. Lichtenberg and M. Gárate for fruitful discussion. We further thank the anonymous referee for their insightful comments. R.B. acknowledges the financial support from the SNSF under grant P2BEP2_195285. Parts of this work were supported by the DFG Research Unit FOR2544 “Blue Planets around Red Stars”, project no. RE 2694/4-1. T.B. acknowledges funding from the European Research Council (ERC) under the European Union’s Horizon 2020 research and innovation programme under grant agreement No 714769 and funding by the Deutsche Forschungsgemeinschaft (DFG, German Research Foundation) under grants 361140270, 325594231, and Germany’s Excellence Strategy – EXC-2094 - 390783311. The plots shown in this work were generated using matplotlib (Hunter 2007) and seaborn (https://seaborn.pydata.org/index.html).
Appendix A Dust entrainment of settled dust
In addition to the dust entrainment model presented in Sect. 2.4, we explore the case of a completely settled disk. As discussed in the main text, this is not adopted as the nominal model because the effect of vertical advection of dust grains is not accounted for in this case (Booth & Clarke 2021). Nevertheless, it is an assumption still under discussion (Hutchison & Clarke 2021; Franz et al. 2022a).
We start with the model of S20, but instead of taking δdg = Σdust/Σg and midplane values for q, we explore the case of a vertically settled distribution of dust without advection. To study this, we calculated a z-dependent volume density of dust. To pinpoint the location of the base of the photoevaporative flow, we needed to determine the height where the gas density is (Hollenbach et al. 1994, eq. 3.1 or Owen et al. 2012, eq. 3)

where cs is the isothermal sound speed that we used as typical speed of the photoevaporative wind. We note that a more detailed treatment for the wind speed (e.g., Hutchison et al. 2016) is not required for our purposes and would vary by less than a factor of four. Furthermore, at large heights, the assumption of constant vertical gravity (z ≪ r) and the assumption that the disk is isothermal in the vertical direction do not hold. Therefore, a more complete picture could be obtained in future works by accounting for this, by numerically calculating the vertical disk temperature profile and setting the base of the photoevaporative flow to the layer where the temperature exceeds the escape temperature (Ercolano et al. 2009).
For a hydrostatic vertical disk, the squared elevation of the base of the flow above the midplane (measured in gas scale heights) using the simple approach of Eq. (A.1) is thus

where we introduced a lower limit of zero to avoid nonphysical imaginary z values. We note that this height is only approximate for large elevations but is sufficiently precise for our purposes. To assess the influence of allowing for arbitrarily large zbase values, we further conducted a test where the maximum zbase was limited to 2Hg, which led to some negligible, but nonzero entrainment also in internally driven winds for nominal parameters.
With this value we can move to the dust component of the disk. For a given diffusion coefficient D, Fromang & Nelson (2009) solved the equations of vertical diffusion and settling of dust in a steady state. We divided their result (Fromang & Nelson 2009, Eq. 19) by the gas density to get
![${\delta _{{\rm{dg}}}}\left( z \right) = {\delta _{{\rm{dg,mid}}}}\exp \left[ { - {{{\rm{S}}{{\rm{t}}_{{\rm{mid}}}}{\rm{Sc}}} \over \alpha }\left( {\exp \left( {{{{z^2}} \over {2H_{\rm{g}}^2}}} \right) - 1} \right)} \right],$](/articles/aa/full_html/2022/10/aa43262-22/aa43262-22-eq68.png)
where Sc is the Schmidt number, which we set to unity, and therefore neglected terms of O(St2) in the exponent (Youdin & Lithwick 2007; Birnstiel et al. 2016).
To make use of the two-population model, we evaluated expression (A.3) at z = zbase for both the large (δdg,mid,1 ≈ δdg,midfm) and the small (δdg,mid,0 ≈ δdg,mid(1 − fm)) particle sizes with midplane Stokes numbers Stmid,1 and Stmid,0 to get
![${\delta _{{\rm{dg,0,1}}}}\left( {{z_{{\rm{base}}}}} \right) = {\delta _{{\rm{dg,mid,0,1}}}}\exp \left[ { - {{{\rm{S}}{{\rm{t}}_{{\rm{mid,0,1}}}}} \over \alpha }\left( {\sqrt {{2 \over \pi }} {{{{\rm{\Omega }}_{\rm{K}}}{{\rm{\Sigma }}_{\rm{g}}}} \over {{{{\rm{\dot \Sigma }}}_{\rm{g}}}}} - 1} \right)} \right].$](/articles/aa/full_html/2022/10/aa43262-22/aa43262-22-eq69.png)
Those could then be used to calculate a dust-evolution- and height-dependent slope of the size distribution

where the summand of two enters, due to the base changing from masses to sizes.
Furthermore, we can use δdg,1 and δdg,2 in Eq. (29). For this last step, we assumed that the two dust populations at the base of the wind are dominated by the exp(-St) term in Eq. (A.3), and thus we simply summed up the two contributions (δdg(zbase) ≈ δdg,1 + δdg,0), because  .
.
References
- Adams, F. C. 2010, ArA&A, 48, 47 [NASA ADS] [CrossRef] [Google Scholar]
- Alcalá, J. M., Natta, A., Manara, C. F., et al. 2014, A&A, 561, A2 [NASA ADS] [CrossRef] [EDP Sciences] [Google Scholar]
- Alcalá, J. M., Manara, C. F., Natta, A., et al. 2017, A&A, 600, A20 [NASA ADS] [CrossRef] [EDP Sciences] [Google Scholar]
- Ansdell, M., Williams, J. P., van der Marel, N., et al. 2016, ApJ, 828, 46 [Google Scholar]
- Ansdell, M., Williams, J. P., Manara, C. F., et al. 2017, AJ, 153, 240 [Google Scholar]
- Ansdell, M., Williams, J. P., Trapman, L., et al. 2018, ApJ, 859, 21 [NASA ADS] [CrossRef] [Google Scholar]
- Bai, X. N., & Stone, J. M. 2013, ApJ, 769, 76 [NASA ADS] [CrossRef] [Google Scholar]
- Bai, X.-N., Ye, J., Goodman, J., & Yuan, F. 2016, ApJ, 818, 152 [Google Scholar]
- Baraffe, I., Homeier, D., Allard, F., & Chabrier, G. 2015, A&A, 577, A42 [NASA ADS] [CrossRef] [EDP Sciences] [Google Scholar]
- Barenfeld, S. A., Carpenter, J. M., Ricci, L., & Isella, A. 2016, ApJ, 827, 142 [Google Scholar]
- Bell, K. R., & Lin, D. N. C. 1994, ApJ, 427, 987 [NASA ADS] [CrossRef] [Google Scholar]
- Birnstiel, T., Dullemond, C. P., & Brauer, F. 2010, A&A, 513, A79 [NASA ADS] [CrossRef] [EDP Sciences] [Google Scholar]
- Birnstiel, T., Ormel, C. W., & Dullemond, C. P. 2011, A&A, 525, A11 [NASA ADS] [CrossRef] [EDP Sciences] [Google Scholar]
- Birnstiel, T., Klahr, H., & Ercolano, B. 2012, A&A, 539, A148 [NASA ADS] [CrossRef] [EDP Sciences] [Google Scholar]
- Birnstiel, T., Fang, M., & Johansen, A. 2016, Space Sci. Rev., 205, 41 [Google Scholar]
- Blum, J. 2010, Res. Astron. Astrophys., 10, 1199 [Google Scholar]
- Booth, R. A., & Clarke, C. J. 2021, MNRAS, 502, 1569 [NASA ADS] [CrossRef] [Google Scholar]
- Burns, J. A., Lamy, P. L., & Soter, S. 1979, Icarus, 40, 1 [Google Scholar]
- Chiang, E. I., & Goldreich, P. 1997, ApJ, 490, 368 [Google Scholar]
- Cleeves, L. I., Öberg, K. I., Wilner, D. J., et al. 2016, ApJ, 832, 110 [Google Scholar]
- Dohnanyi, J. S. 1969, J. Geophys. Res., 74, 2531 [Google Scholar]
- Dullemond, C. P., Birnstiel, T., Huang, J., et al. 2018, ApJ, 869, L46 [NASA ADS] [CrossRef] [Google Scholar]
- Emsenhuber, A., Mordasini, C., Burn, R., et al. 2021, A&A, 656, A69 [NASA ADS] [CrossRef] [EDP Sciences] [Google Scholar]
- Ercolano, B., Clarke, C. J., & Drake, J. J. 2009, ApJ, 699, 1639 [Google Scholar]
- Ercolano, B., Picogna, G., Monsch, K., Drake, J. J., & Preibisch, T. 2021, MNRAS, 508, 1675 [NASA ADS] [CrossRef] [Google Scholar]
- Facchini, S., Clarke, C. J., & Bisbas, T. G. 2016, MNRAS, 457, 3593 [NASA ADS] [CrossRef] [Google Scholar]
- Flaherty, K. M., Hughes, A. M., Rose, S. C., et al. 2017, ApJ, 843, 150 [NASA ADS] [CrossRef] [Google Scholar]
- Franz, R., Picogna, G., Ercolano, B., & Birnstiel, T. 2020, A&A, 635, A53 [EDP Sciences] [Google Scholar]
- Franz, R., Ercolano, B., Casassus, S., et al. 2022a, A&A, 657, A69 [NASA ADS] [CrossRef] [EDP Sciences] [Google Scholar]
- Franz, R., Picogna, G., Ercolano, B., et al. 2022b, A&A, 659, A90 [NASA ADS] [CrossRef] [EDP Sciences] [Google Scholar]
- Fromang, S., & Nelson, R. P. 2009, A&A, 496, 597 [NASA ADS] [CrossRef] [EDP Sciences] [Google Scholar]
- Gárate, M., Birnstiel, T., Drazkowska, J., & Stammler, S. M. 2020, A&A, 635, A149 [NASA ADS] [CrossRef] [EDP Sciences] [Google Scholar]
- Gárate, M., Delage, T.N., Stadler, J., et al. 2021, A&A, 655, A18 [NASA ADS] [CrossRef] [EDP Sciences] [Google Scholar]
- Gerbig, K., Lenz, C. T., & Klahr, H. 2019, A&A, 629, A116 [NASA ADS] [CrossRef] [EDP Sciences] [Google Scholar]
- Gerbig, K., Murray-Clay, R. A., Klahr, H., & Baehr, H. 2020, ApJ, 895, 91 [CrossRef] [Google Scholar]
- Grün, E., Zook, H., Fechtig, H., & Giese, R. 1985, Icarus, 62, 244 [NASA ADS] [CrossRef] [Google Scholar]
- Güdel, M., Briggs, K. R., Arzner, K., et al. 2007, A&A, 468, 353 [Google Scholar]
- Gundlach, B., Schmidt, K. P., Kreuzig, C., et al. 2018, MNRAS, 479, 1273 [NASA ADS] [CrossRef] [Google Scholar]
- Habing, H. J. 1968, Bull. Astron. Inst. Netherlands, 19, 421 [Google Scholar]
- Haisch, K. E., Lada, E. A., & Lada, C. J. 2001, ApJ, 553, L153 [NASA ADS] [CrossRef] [Google Scholar]
- Haworth, T. J., & Clarke, C. J. 2019, MNRAS, 485, 3895 [NASA ADS] [CrossRef] [Google Scholar]
- Haworth, T. J., Clarke, C. J., Rahman, W., Winter, A. J., & Facchini, S. 2018, MNRAS, 481, 452 [NASA ADS] [CrossRef] [Google Scholar]
- Hollenbach, D., Johnstone, D., Lizano, S., & Shu, F. 1994, ApJ, 428, 654 [NASA ADS] [CrossRef] [Google Scholar]
- Hueso, R., & Guillot, T. 2005, A&A, 442, 703 [NASA ADS] [CrossRef] [EDP Sciences] [Google Scholar]
- Hunter, J. D. 2007, Comput. Sci. Eng., 9, 90 [NASA ADS] [CrossRef] [Google Scholar]
- Hutchison, M. A., & Clarke, C. J. 2021, MNRAS, 501, 1127 [Google Scholar]
- Hutchison, M. A., Laibe, G., & Maddison, S. T. 2016, MNRAS, 463, 2725 [NASA ADS] [CrossRef] [Google Scholar]
- Johansen, A., Oishi, J. S., Low, M.-M.M., et al. 2007, Nature, 448, 1022 [NASA ADS] [CrossRef] [Google Scholar]
- Klahr, H., & Hubbard, A. 2014, ApJ, 788, 21 [Google Scholar]
- Klahr, H. H., & Lin, D. N. C. 2001, ApJ, 554, 1095 [NASA ADS] [CrossRef] [Google Scholar]
- Klahr, H., & Schreiber, A. 2020, ApJ, 901, 54 [NASA ADS] [CrossRef] [Google Scholar]
- Klahr, H., & Schreiber, A. 2021, ApJ, 911, 9Kobayashi, H., Watanabe, S.-I., Kimura, H., & Yamamoto, T. 2009, Icarus, 201, 395 [Google Scholar]
- Lenz, C. T., Klahr, H., & Birnstiel, T. 2019, ApJ, 874, 36 [NASA ADS] [CrossRef] [Google Scholar]
- Lynden-Bell, D., & Pringle, J. E. 1974, MNRAS, 168, 603 [Google Scholar]
- Manara, C. F., Fedele, D., Herczeg, G. J., & Teixeira, P. S. 2016, A&A, 585, A136 [NASA ADS] [CrossRef] [EDP Sciences] [Google Scholar]
- Manara, C. F., Testi, L., Herczeg, G. J., et al. 2017, A&A, 604, A127 [NASA ADS] [CrossRef] [EDP Sciences] [Google Scholar]
- Manara, C. F., Natta, A., Rosotti, G. P., et al. 2020, A&A, 639, A58 [NASA ADS] [CrossRef] [EDP Sciences] [Google Scholar]
- Mathis, J. S., Rumpl, W., & Nordsieck, K. H. 1977, ApJ, 217, 425 [Google Scholar]
- Matsuyama, I., Johnstone, D., & Hartmann, L. 2003, ApJ, 582, 893 [NASA ADS] [CrossRef] [Google Scholar]
- Michel, A., van der Marel, N., & Matthews, B.C. 2021, ApJ, 921, 72 [CrossRef] [Google Scholar]
- Musiolik, G., & Wurm, G. 2019, ApJ, 873, 58 [NASA ADS] [CrossRef] [Google Scholar]
- Nakagawa, Y., Sekiya, M., & Hayashi, C. 1986, Icarus, 67, 375 [Google Scholar]
- Nakamoto, T., & Nakagawa, Y. 1994, ApJ, 421, 640 [Google Scholar]
- Ormel, C. W., & Cuzzi, J. N. 2007, A&A, 466, 413 [NASA ADS] [CrossRef] [EDP Sciences] [Google Scholar]
- Ormel, C. W., & Klahr, H. 2010, A&A, 520, A43 [NASA ADS] [CrossRef] [EDP Sciences] [Google Scholar]
- Owen, J. E., & Kollmeier, J. A. 2019, MNRAS, 487, 3702 [Google Scholar]
- Owen, J. E., Ercolano, B., & Clarke, C. J. 2011a, MNRAS, 412, 13 [Google Scholar]
- Owen, J. E., Ercolano, B., & Clarke, C. J. 2011b, MNRAS, 411, 1104 [NASA ADS] [CrossRef] [Google Scholar]
- Owen, J. E., Clarke, C. J., & Ercolano, B. 2012, MNRAS, 422, 1880 [Google Scholar]
- Pascucci, I., Testi, L., Herczeg, G. J., et al. 2016, ApJ, 831, 125 [Google Scholar]
- Picogna, G., Ercolano, B., Owen, J. E., & Weber, M. L. 2019, MNRAS, 487, 691 [Google Scholar]
- Picogna, G., Ercolano, B., & Espaillat, C. C. 2021, MNRAS, 508, 3611 [NASA ADS] [CrossRef] [Google Scholar]
- Pinilla, P., Lenz, C. T., & Stammler, S. M. 2021, A&A, 645, A70 [NASA ADS] [CrossRef] [EDP Sciences] [Google Scholar]
- Pringle, J. E. 1981, ArA&A, 19 [Google Scholar]
- Richert, A. J. W., Getman, K. V., Feigelson, E. D., et al. 2018, MNRAS, 477, 5191 [NASA ADS] [CrossRef] [Google Scholar]
- Robertson, H. P., & Russell, H. N. 1937, MNRAS, 97, 423 [NASA ADS] [CrossRef] [Google Scholar]
- Rosotti, G. P., Teague, R., Dullemond, C., Booth, R. A., & Clarke, C. J. 2020, MNRAS, 495, 173 [Google Scholar]
- Santos, N. C., Israelian, G., Mayor, M., Rebolo, R., & Udry, S. 2003, A&A, 398, 363 [NASA ADS] [CrossRef] [EDP Sciences] [Google Scholar]
- Savvidou, S., Bitsch, B., & Lambrechts, M. 2020, A&A, 640, A63 [NASA ADS] [CrossRef] [EDP Sciences] [Google Scholar]
- Sellek, A. D., Booth, R. A., & Clarke, C. J. 2020, MNRAS, 492, 1279 [NASA ADS] [CrossRef] [Google Scholar]
- Shakura, N. I., & Sunyaev, R. A. 1973, A&A, 24, 337 [NASA ADS] [Google Scholar]
- Steinpilz, T., Teiser, J., & Wurm, G. 2019, ApJ, 874, 60 [NASA ADS] [CrossRef] [Google Scholar]
- Takeuchi, T., & Lin, D. N. C. 2003, ApJ, 593, 524 [NASA ADS] [CrossRef] [Google Scholar]
- Thébault, P. 2009, A&A, 505, 1269 [Google Scholar]
- Tobin, J. J., Sheehan, P. D., Megeath, S. T., et al. 2020, ApJ, 890, 130 [CrossRef] [Google Scholar]
- Voelkel, O., Klahr, H., Mordasini, C., Emsenhuber, A., & Lenz, C. 2020, A&A, 642, A75 [NASA ADS] [CrossRef] [EDP Sciences] [Google Scholar]
- von Weizsäcker, C. F. 1948, Z. Naturfor. A, 3, 524 [CrossRef] [Google Scholar]
- Weidenschilling, S. J. 1977, MNRAS, 180, 57 [Google Scholar]
- Whipple, F. L. 1972, in From Plasma to Planet, ed. A. Elvius (Wiley), 211 [Google Scholar]
- Wyatt, M. C. 2008, ArA&A, 46, 339 [NASA ADS] [CrossRef] [Google Scholar]
- Wyatt, S. P., & Whipple, F. L. 1950, ApJ, 111, 134 [NASA ADS] [CrossRef] [Google Scholar]
- Youdin, A. N., & Lithwick, Y. 2007, Icarus, 192, 588 [NASA ADS] [CrossRef] [Google Scholar]
Ffuv is usually given in terms of G0, which corresponds to the typical interstellar radiation field for FUV (Habing 1968).
S20 set amin ≈ 0 in Eq. (28), while we keep the minimum value to have a higher precision in regimes where little growth occurred.
τmid,dust should, in principle, be equivalent to the τmid that is used for the temperature calculation (Sect. 2.1). However, we refrained from consistently coupling the dust evolution to the temperature at this time.
We note that Pinilla et al. (2021) propose modifying the vertical turbulence, which has, to first order, the same effect as changing vfrag.
All Tables
All Figures
|
Fig. 1 Dust and pebble mass evolution for different dust entrainment models. The top panel shows the mass content at a given time after the start of the solid evolution, while the lower panel shows the cumulative mass entrained in evaporative winds. Different calculations are shown for the nominal dust entrainment model (thick blue line), a model without any dust entrainment (dotted red line), and the model with settled dust (dashed green line, see Appendix A). |
| In the text | |
|
Fig. 2 Snapshot of the gas and dust disk after 10kyr of solid evolution for the nominal and the settling models. The two upper panels show the surface density of gas (identical for both cases), and combined dust and pebbles, the third panel shows the dust and pebble removal rate, and the bottom panel shows the typical pebble size a1. The shaded region spans from the monomer grain size to a1. In addition to the two different entrainment models, we also show critical entrainment sizes at the midplane (bottom panel) and the integrated gas photoevaporation rate (top panel) according to the legends in the upper left corners. |
| In the text | |
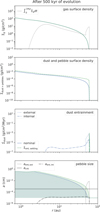 |
Fig. 3 As for Fig. 2, but after 500 kyr of evolution. |
| In the text | |
|
Fig. 4 Long-term dust and pebble disk mass evolution (top), as well as dust mass ejected due to radiation pressure (middle) and accreted onto the star (bottom). All models start with a low vfrag of 1 × 10⁻² cm s−1 and do not include the effect of dust entrainment in photoevaporative winds. The thick gray line denotes the model without Poynting–Robertson drag but with direct ejection of the smallest grains due to radiation pressure. The inverted assumptions are shown with a green line. The nominal model (dotted black line) includes both effects and is equivalent to the low-vftag case shown in the top row of Fig. 5. |
| In the text | |
|
Fig. 5 Dust and pebble mass evolution for different parameters. The dashed (dotted) line corresponds to enlarged (lowered) values by the variation indicated in Table 1. All simulations were performed using the nominal dust photoevaporation model and including removal and Poynting–Robertson drag of dust due to radiation pressure. The top row shows the influence of dust-evolution parameters, the middle row shows results for varied initial disk conditions, and the bottom row shows simulations with different gas-evolution parameters. For several parameters, radiation-removed masses lie below 1 × 10⁻² M⊕ and are, therefore, not visible. |
| In the text | |
|
Fig. 6 Dust and pebble mass (top) and cumulative entrained mass (bottom) evolution for different X-ray luminosities. LX controls the strength of internally driven photoevaporation in our prescription from Picogna et al. (2021). Except for the nominal case, we use reduced FFUV. |
| In the text | |
Current usage metrics show cumulative count of Article Views (full-text article views including HTML views, PDF and ePub downloads, according to the available data) and Abstracts Views on Vision4Press platform.
Data correspond to usage on the plateform after 2015. The current usage metrics is available 48-96 hours after online publication and is updated daily on week days.
Initial download of the metrics may take a while.