Fig. 2
Download original image
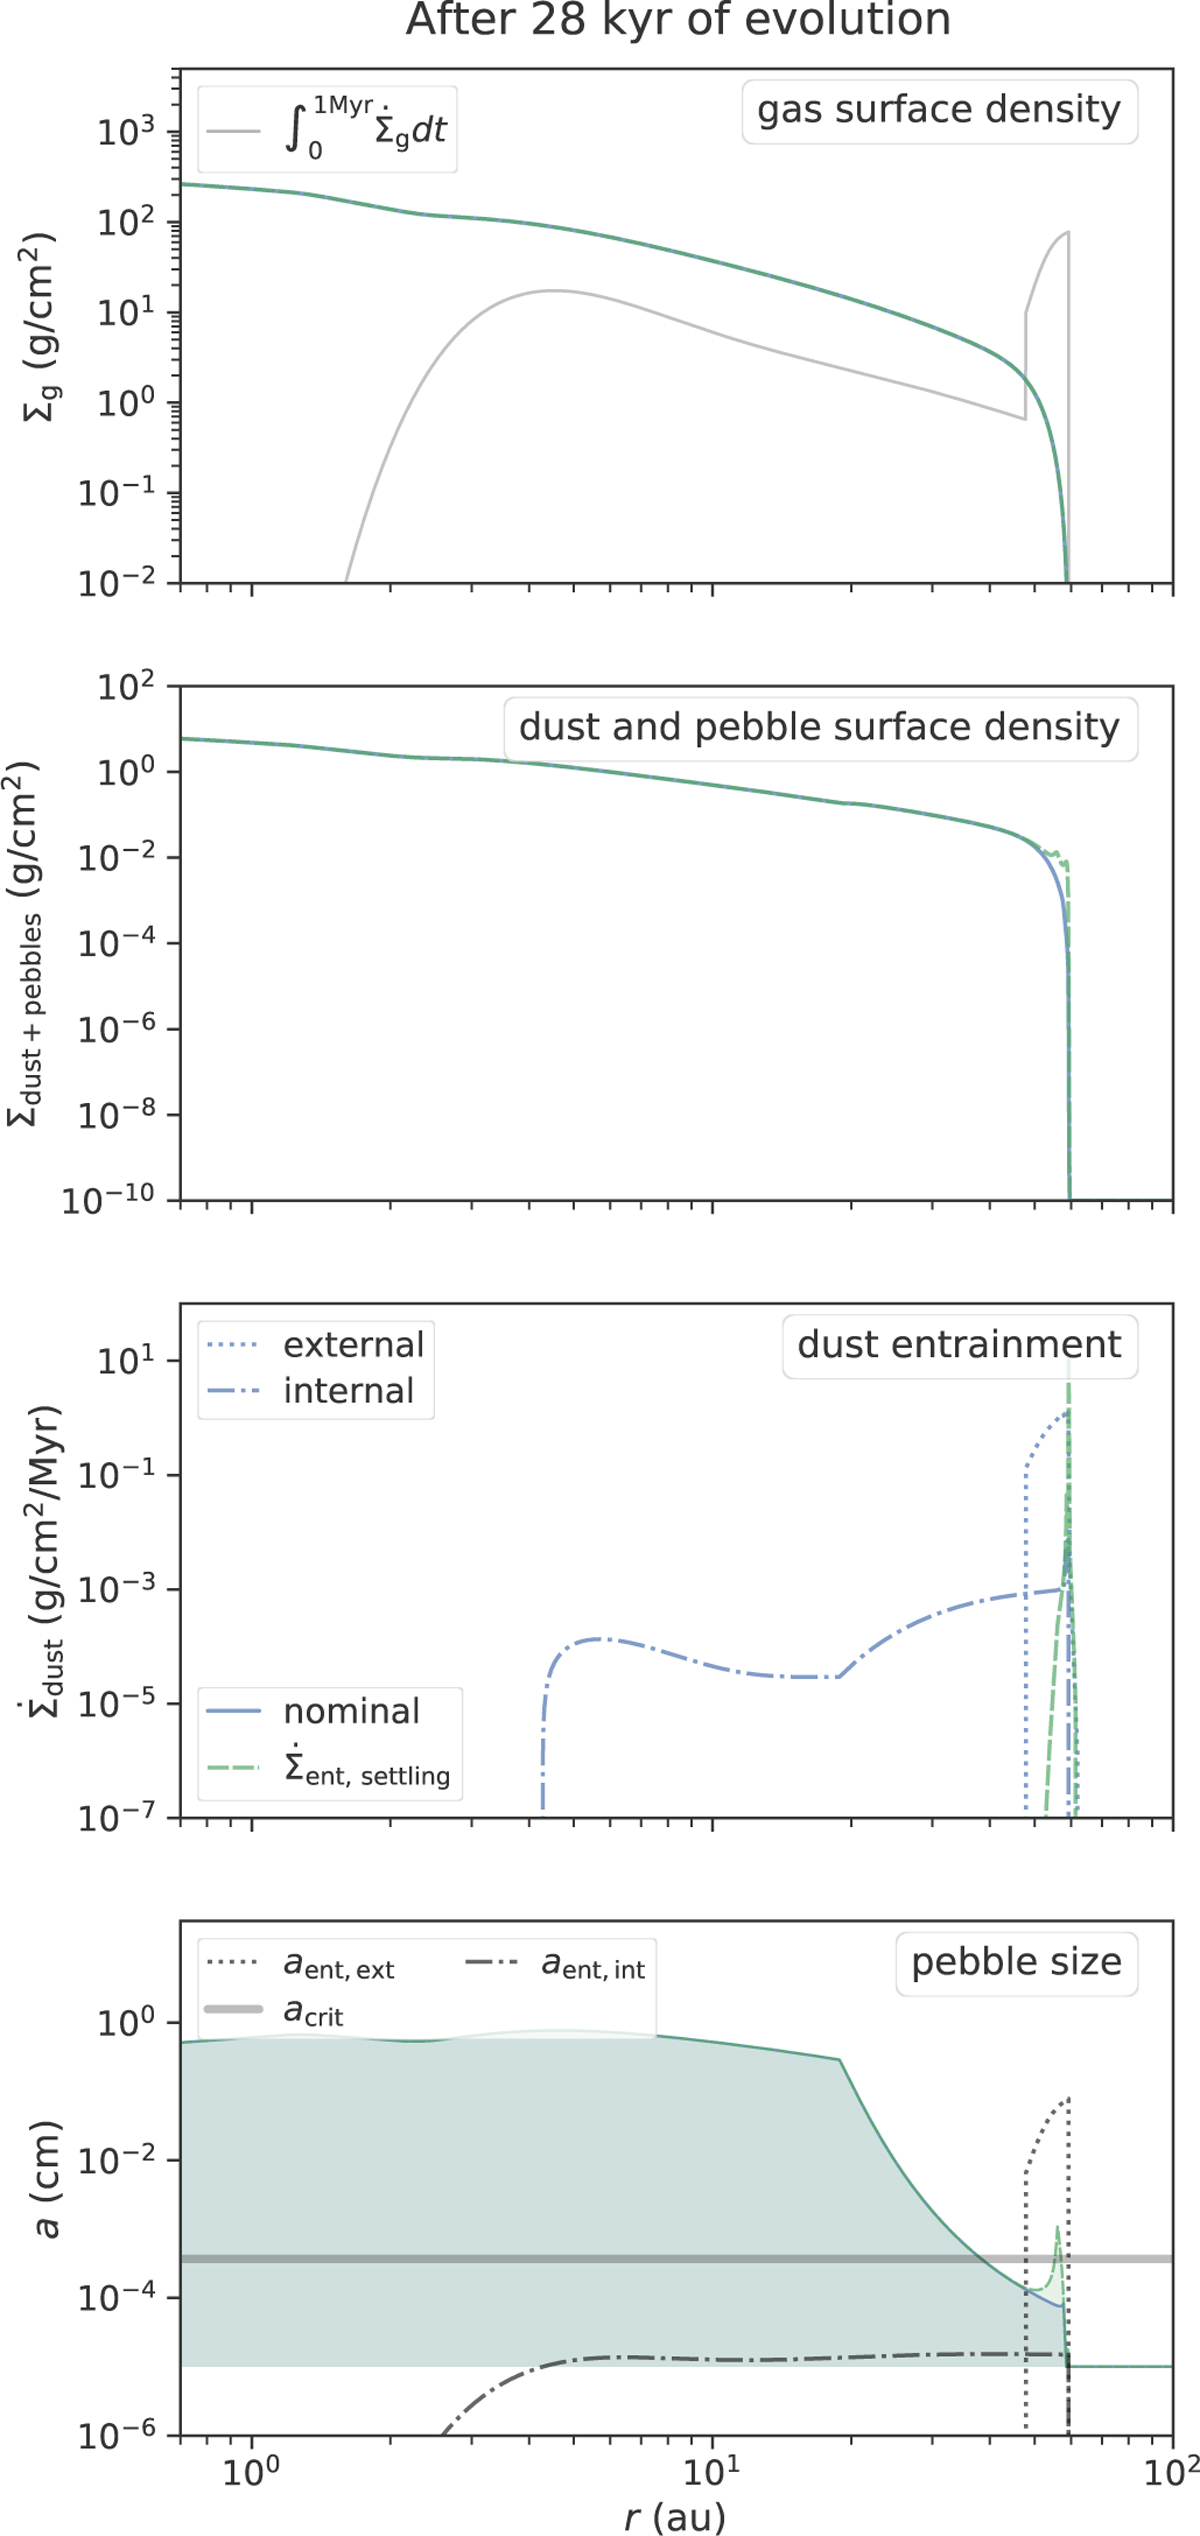
Snapshot of the gas and dust disk after 10kyr of solid evolution for the nominal and the settling models. The two upper panels show the surface density of gas (identical for both cases), and combined dust and pebbles, the third panel shows the dust and pebble removal rate, and the bottom panel shows the typical pebble size a1. The shaded region spans from the monomer grain size to a1. In addition to the two different entrainment models, we also show critical entrainment sizes at the midplane (bottom panel) and the integrated gas photoevaporation rate (top panel) according to the legends in the upper left corners.
Current usage metrics show cumulative count of Article Views (full-text article views including HTML views, PDF and ePub downloads, according to the available data) and Abstracts Views on Vision4Press platform.
Data correspond to usage on the plateform after 2015. The current usage metrics is available 48-96 hours after online publication and is updated daily on week days.
Initial download of the metrics may take a while.