Fig. 1
Download original image
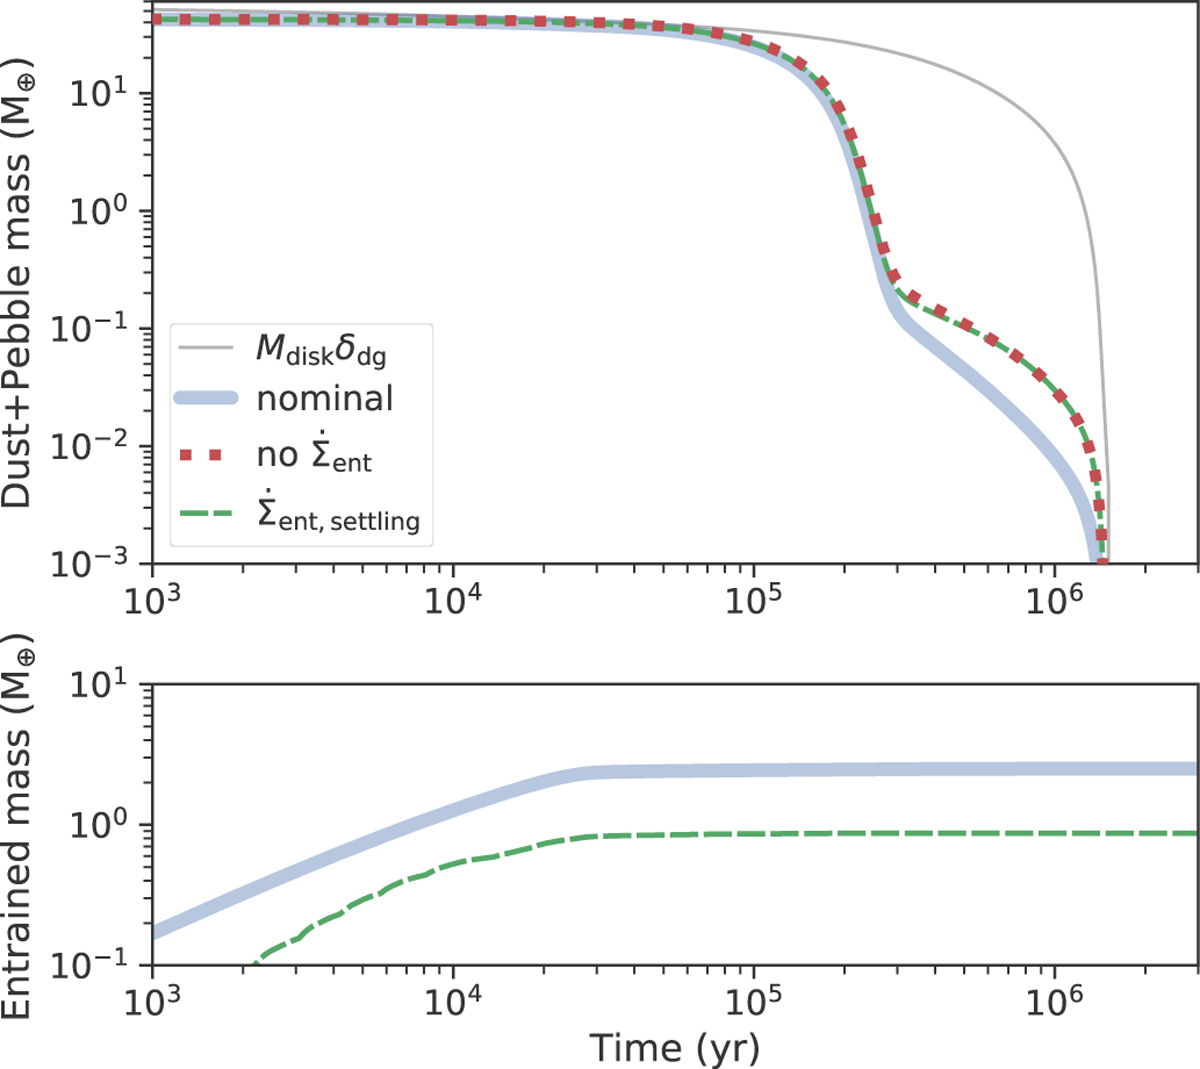
Dust and pebble mass evolution for different dust entrainment models. The top panel shows the mass content at a given time after the start of the solid evolution, while the lower panel shows the cumulative mass entrained in evaporative winds. Different calculations are shown for the nominal dust entrainment model (thick blue line), a model without any dust entrainment (dotted red line), and the model with settled dust (dashed green line, see Appendix A).
Current usage metrics show cumulative count of Article Views (full-text article views including HTML views, PDF and ePub downloads, according to the available data) and Abstracts Views on Vision4Press platform.
Data correspond to usage on the plateform after 2015. The current usage metrics is available 48-96 hours after online publication and is updated daily on week days.
Initial download of the metrics may take a while.