Fig. 5
Download original image
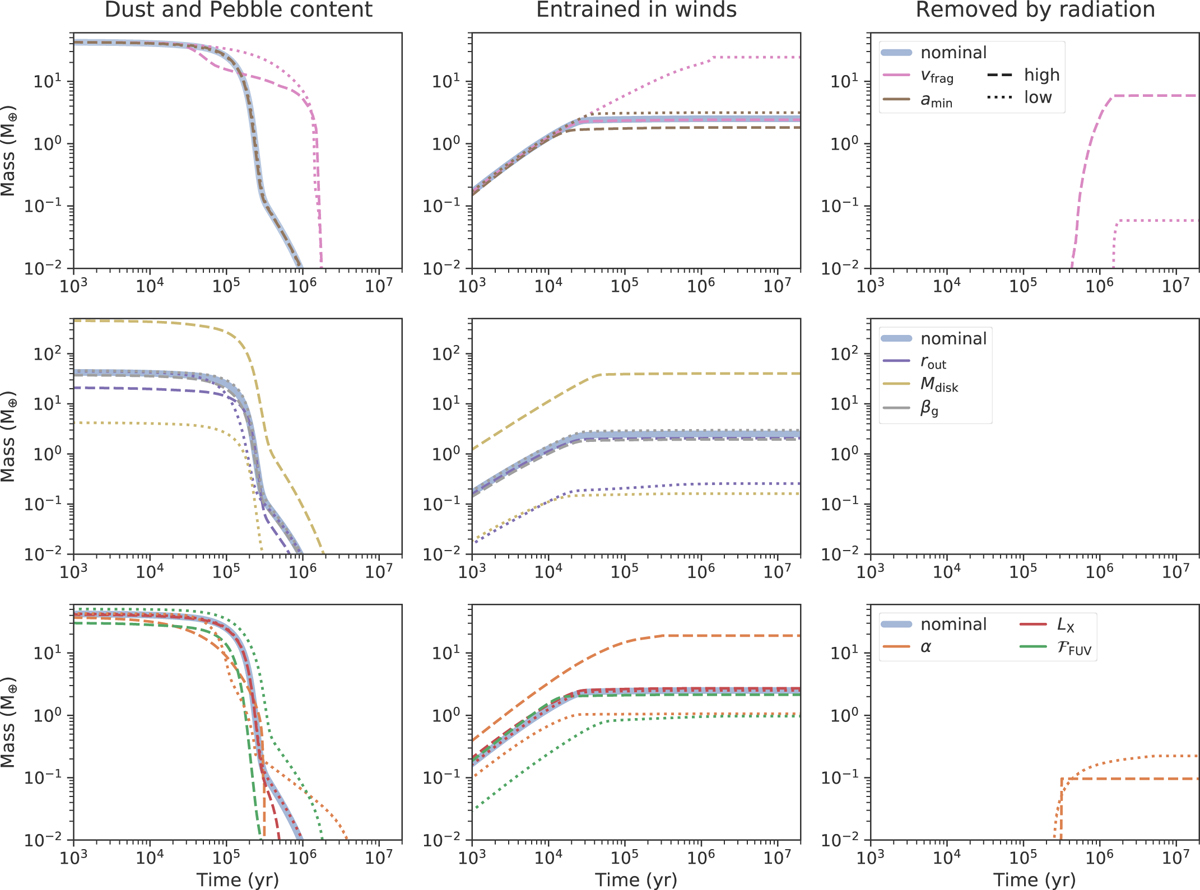
Dust and pebble mass evolution for different parameters. The dashed (dotted) line corresponds to enlarged (lowered) values by the variation indicated in Table 1. All simulations were performed using the nominal dust photoevaporation model and including removal and Poynting–Robertson drag of dust due to radiation pressure. The top row shows the influence of dust-evolution parameters, the middle row shows results for varied initial disk conditions, and the bottom row shows simulations with different gas-evolution parameters. For several parameters, radiation-removed masses lie below 1 × 10⁻² M⊕ and are, therefore, not visible.
Current usage metrics show cumulative count of Article Views (full-text article views including HTML views, PDF and ePub downloads, according to the available data) and Abstracts Views on Vision4Press platform.
Data correspond to usage on the plateform after 2015. The current usage metrics is available 48-96 hours after online publication and is updated daily on week days.
Initial download of the metrics may take a while.