| Issue |
A&A
Volume 627, July 2019
|
|
|---|---|---|
| Article Number | A95 | |
| Number of page(s) | 10 | |
| Section | Interstellar and circumstellar matter | |
| DOI | https://doi.org/10.1051/0004-6361/201935436 | |
| Published online | 05 July 2019 | |
Standing in the shadow of dark gas: ALMA observations of absorption from dark CO in the molecular dark neutral medium of Chamaeleon★
1
National Radio Astronomy Observatory,
520 Edgemont Road,
Charlottesville,
VA
22903, USA
e-mail: hliszt@nrao.edu
2
LERMA, Observatoire de Paris, PSL Research University, CNRS Sorbonne Universités, UPMC Université Paris 06, Ecole Normale Supérieure,
75005 Paris, France
3
Département d’Astrophysique, AIM, CEA-IRFU/CNRS/Université Paris Diderot, CEA, Saclay, 91191
Gif-sur-Yvette, France
Received:
8
March
2019
Accepted:
1
May
2019
Context. We previously detected 89.2 GHz J = 1−0 HCO+ absorption in 12 directions lacking detected CO emission in the outskirts of the Chamaeleon cloud complex and toward one sightline with integrated CO emission WCO = 2.4 K km s−1. Eight sightlines had a much larger mean column density of dark neutral medium (DNM) – gas not represented in HI or CO emission – and were found to have much higher mean molecular column density. The five other sightlines had little or no DNM and were found to have much smaller but still detectable N(HCO+).
Aims. To determine the CO column density along previously observed Chamaeleon sightlines and to determine why CO emission was not detected in directions where molecular gas is present.
Methods. We took 12CO J = 1−0 absorption profiles toward five sightlines having higher DNM and HCO+ column densities and one sightline with smaller N(DNM) and N(HCO+). We converted the integrated HCO+ optical depths to N(H2) in the weak-excitation limit using N(HCO+)/N(H2) = 3 × 10⁻⁹ and converted the integrated CO optical depths ϒCO to CO column density using the relationship N(CO) = 1.861 × 1015 cm−2 ϒCO1.131 found along comparable lines of sight that were previously studied in J = 1−0 and J = 2−1 CO absorption and emission.
Results. CO absorption was detected along the five sightlines in the higher-DNM group, with CO column densities 4 × 1013 cm−2≲ N(CO) ≲1015 cm−2 that are generally below the detectability limit of CO emission surveys.
Conclusions. In the outskirts of the Chamaeleon complex, the presence of molecular DNM resulted primarily from small CO column densities at the onset of CO formation around the HI/H2 transition in diffuse molecular gas. CO relative abundances N(CO)/H2 ≲2 × 10⁻⁶ in the outskirts of Chamaeleon are comparable to those seen in UV absorption toward early-type stars, including in Chamaeleon.
Key words: ISM: molecules / dust, extinction / ISM: clouds
The data are only available at the CDS via anonymous ftp to cdsarc.u-strasbg.fr (130.79.128.5) or via http://cdsarc.u-strasbg.fr/viz-bin/qcat?J/A+A/627/A95
© ESO 2019
1 Introduction
The total gas column densities that are jointly traced by dust and by cosmic-ray interactions exhibit large excesses over those inferred from HI and CO line emission in galactic molecular cloud complexes (Grenier et al. 2005), including in Chamaeleon (Planck Collaboration Int. XXVIII 2015). In a recent paper (Liszt et al. 2018; Paper I) we sought evidence of a hidden molecular gas reservoir in Chamaeleon. We presented observations of absorption from λ3 mm J = 1−0 lines HCO +, HCN, and C2 H toward thirteen compact extragalactic continuum sources seen against the outskirts of the Chamaeleon cloud complex. We detected HCO + absorption in all directions even though CO emission was firmly detected in only one of these.
Taking an abundance ratio N(HCO+)/N(H2) = 3 × 10⁻⁹ we compared the inferred column densities of H2 to those of the dark neutral medium (DNM), the gas inferred to be present from maps of sub-mm dust opacity and gamma-ray emissivity (Planck Collaboration Int. XXVIII 2015; Remy et al. 2018) but not apparently represented in λ21 cm HI or λ2.6 mm CO line emission. We found that gas in the outskirts of Chamaeleon was mostly atomic (HI rather than H2) but that the DNM was mostly molecular, resulting from failure of the integrated CO J = 1−0 emission WCO to represent the true amount of molecular hydrogen when using a standard CO-H2 conversion factor N(H2)/WCO = 2 × 1020 cm−2 (K km s−1)−1. Saturation of the HI emission profile might have contributed significantly to N(DNM) in three directions but did not create the need for the DNM.
Here we ask why CO emission did not represent the molecular gas component adequately: perhaps as the result of inadequate rotational excitation ofthe CO, or perhaps as the result of there being only very small CO column densities at the onset of CO formation around the HI–H2 transition. In the present work we observed λ2.6 mm J = 1 − 0 CO absorption toward six of the thirteen sources observed in our earlier paper, five in the group of eight directions showing more DNM and H2, and (because it was convenient) one direction in the group of five showing little or no DNM and much smaller but still non-zero N(HCO+). The integrated CO optical depths are converted to CO column density using the tight relationship defined along comparable lines of sight previously studied in CO J = 1−0 and J = 2−1 absorption and emission by Liszt & Lucas (1998).
The organization of this paper is as follows. In Sect. 2 we discuss the new and existing observational material that is presented here and give the background of the integrated optical depth – column density conversion for the CO J = 1−0 absorption profiles. Section 3 presents the results of this work and, in Sect. 4, drawing on earlier studies of the excitation of CO, we show that the failure of CO emission to represent N(H2) is due to small CO column densities N(CO) and relative abundances N(CO)/N(H2) that are familiar from studies of UV absorption at comparable reddening E(B–V). Section 5 slightly extends the DNM analysis of Paper I using direct UV absorption measurements of N(H2) and N(CO) toward a handful of stars seen toward Chamaeleon and Sect. 6 is a summary.
Sightline and velocity-integrated spectral line properties.
2 Observations, data reduction and optical depth–column density conversion
2.1 Conventions
In this work, N(H) is the column density of H-nuclei in neutral atomic and molecular form, N(H) = N(HI) + 2N(H2). We denote the observed, integrated J = 1−0 optical depths of the J = 1−0 CO and HCO+ transitions as ϒCO = ∫ τ0,1(CO) dv and  = ∫ τ0,1(HCO+) dv. Velocities presented with the spectra are measured with respect to the kinematic definition of the Local Standard of Rest.
2.2 New ALMA absorption measurements
We observed the J = 1−0 lines of 12CO and 12 CN in absorption toward the six continuum sources whose line of sight properties are given in Table 1; the resulting CO line profiles are shown in Figs. 1 and 2. The work was conducted under ALMA Cycle 5 project 2017.1.00227.S whose pipeline data products were delivered in 2018 February. The spectra discussed here were extracted from the pipeline-processed, continuum-subtracted data cubes at the pixel of peak continuum flux in the continuum map made from each spectral window, and divided by the continuum flux in the continuum map at that pixel. No (further) baselining of any of the spectra was performed. Fluxes at 115.3 GHz ranged from 0.13 Jy for J1224 and 0.140 for J0942 to 1.68 Jy for J1058: several of the sources were considerably dimmer than in our Cycle 4 HCO+ observations. Each spectrum consisted of 1919 semi-independent channels spaced by 30.503 kHz corresponding to 0.079 km s−1 at the 115.271 GHz rest frequency of 12CO. The channelspacing is half the spectral resolution. CN was very tentatively detected in one direction, toward J1224, and will not be further discussed here.
2.3 Other observational data at radio and UV wavelengths
In Table 1 we quote the integrated HCO+ optical depths from Paper I and the optically thin HI column densities derived from Galactic All-Sky Survey (GASS) III λ21 cm HI emission spectra (Kalberla & Haud 2015). Column densities of HCO+ are taken from Paper I as derived assuming rotational excitation in equilibrium with the cosmic microwave background, N(HCO+) = 1.10 × 1012 cm−2  for a permanent dipole moment μ = 3.89 Debye. Figure 1 shows the NANTEN CO J = 1−0 emission spectra used by Planck Collaboration Int. XXVIII (2015) to derive the column density of DNM along with the CO and HCO+ absorption profiles taken during the course of our work that are shown in more detail in Fig. 2.
Figure 3 shows the N(CO)–ϒCO relation derived from the prior observations of J = 1−0 and J = 2−1 CO emission and absorption by Liszt & Lucas (1998): this is used to convert our new measurements of ϒCO to N(CO) as discussed in Sect. 4.1. Figure 4 compares CO and H2 column densities at radio and UV wavelengths using the results of Burgh et al. (2007), Sonnentrucker et al. (2007) and Sheffer et al. (2008).
2.4 Reddening and dust optical depth
The 6′ resolution dust-emission maps scaled to optical reddening E(B–V) by Schlegel et al. (1998) are used in Tables 1 and 4. These reddening values can be converted to Planck 353 GHz dust optical depth τ353 with errors of order ± 6% using the relationship established by Planck Collaboration XI (2014) between τ353 and reddening determined photometrically toward quasars, E(B–V)/τ353 = (1.49 ± 0.03) × 104 mag.
2.5 Conversion from integrated optical depth to column density for CO
Here we measure the integral of the optical depth of the CO J = 1−0 transition ϒCO and additional assumptions are required to convert this to total CO column density. Most generally, the integrated optical depth of the 12CO J, J + 1 transitions are related to the column densities in rotational levels J and J + 1 and the Einstein B-coefficients as
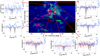 |
Fig. 1 ALMA results in the Chamaeleon complex. Center: RGB image with N(HI) in blue, N(DNM) in green and Nanten CO emission brightness in red. The locations of the 13 ALMA sources studied in Paper I are marked as squares, hatched for the 5 directions where CO absorption was detected in this work. The positions of 8 stars with measured values of N(H2) and N(CO) in UV absorption (Table 3) are marked by x’s. Shown around the outside are HCO + (grey, shaded) andCO (red) absorption and CO emission profiles (blue) from NANTEN on a different vertical scale as noted at right in each outer panel. CO absorption was not observed toward J1723 and was sought but not detected or plotted toward B1251. |
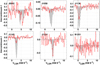 |
Fig. 2 ALMA HCO+ and 12CO absorption profiles for the six sources observed here. The HCO+ profile from Paper I is shown shaded in grey, the 12CO J = 1−0 profile from this work is shown in red. |
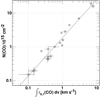 |
Fig. 3 The relationship between integrated CO J = 1−0 optical depth and N(CO) for the data of Liszt & Lucas (1998) who observed J = 1−0 and J = 2−1 CO emission and absorption along comparable sightlines. The power-law fit is N(CO) = 1.861 × 1015 cm−2 ϒCO1.131 where ϒCO = ∫ τ0,1(CO) dν in units of km s−1. |
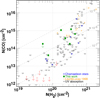 |
Fig. 4 H2 and CO column densities from UV and radio absorption spectra. Shown are UV absorption line measurements from Sonnentrucker et al. (2007), Burgh et al. (2007) and Sheffer et al. (2008) (downward-pointing triangles), mm-wave results from Liszt & Lucas (1998) (small orange circles), and results from this work (green filled squares). Some informative upper limits to UV measurements are shown in red. The mm-wave results assume N(H2) = N(HCO+)/3 × 10−9 and the present results use Eq. (2) to derive N(CO). UV absorption sightlines in Chamaeleon are marked by blue asterisks, see Table 4. Grey dashed lines show the locii of relative abundances N(CO)/N(H2) as indicated. Only sighlines with N(CO) > 1015 cm−2 are observable in present wide-field CO emission surveys. |
![\begin{equation*} \int {\tau_{J,J+1}} \textrm{d}\nu = (h\nu/c)[N_JB_{J,J+1} - N_{J+1}B_{J+1,J}]. \end{equation*}](/articles/aa/full_html/2019/07/aa35436-19/aa35436-19-eq4.png) (1)
(1)
For a linear rotor like CO with a permanent dipole moment μ = 0.11 Debye (1 Debye = 10−18 esu) this can be recast as
 (2)
(2)
where ∫ τJ,J+1 dv is in units of km s−1 and Tex is the excitation temperature between levels J and J + 1, NJ+1 ∕ NJ = (gJ+1 ∕ gJ)exp(−hν ∕ kTex) and gJ = 2J + 1.
CO excitation temperatures are directly observed in diffuse molecular gas toward early-type stars (Burgh et al. 2007; Sonnentrucker et al. 2007; Sheffer et al. 2008) and for the J = 1 − 0 transition these are typically in the range 3–5 K (see Fig. 5 of Liszt 2007 and Table 2 of Goldsmith 2013). Similar values are inferred for gas observed in mm-wave CO absorption (Liszt & Lucas 1998). In the simple case of LTE at a single excitation temperature Tex for all J, the total column density can be written N(CO) = b ϒCO, leading to b = 1.071 × 1015 cm−2 (km s−1)−1 for Tex = 2.73K (the lower limit). Other cases include b = 1.381 × 1015 cm−2 (km s−1)−1 for Tex = 3.5 K, b = 1.614 × 1015 cm−2 (km s−1)−1 for Tex = 4 K and b = 1.871 × 1015 cm−2 (km s−1)−1 for Tex = 4.5 K.
Here we convert the observed values of CO J = 1−0 optical depths to column density using the earlier results of Liszt & Lucas (1998) who determined N(CO) along similar sightlines using J = 1−0 and J = 2−1 observations of CO in absorption and emission. Their results for the integrated J = 1−0 optical depths and CO column densities are very well represented with a slightly super-linear power-law regression fit as discussed in Sect. 4.1. Given the numerical examples in the preceding paragraph, this is roughly equivalent to assuming an excitation temperature of 4.4–4.5 K for the stronger lines observed here (Table 1). An excitation temperature of at least 4.0 K is required to produce a 1 K brightness in CO J = 1−0 emission although a smaller excitation temperature can produce an integrated brightness WCO > 1 K km s−1 with a sufficiently wide line.
As discussed by Liszt & Lucas (1998) and Liszt & Pety (2012), the excitation temperature of the CO J = 1−0 transition scales directly as the ambient thermal pressure of H2 and increases with τ0,1. With a J = 1−0 excitation temperature of 4.5 K the implied partial pressures of H2 are n(H2)TK = 5.8 × 10³ and 4.0 × 103 cm−3 K for τ0,1 (CO) = 0 and 1, respectively. These are typical values for the diffuse ISM sampled in C I by Jenkins & Tripp (2011).
2.6 The relative abundance of HCO+
As in Paper I we use the relative abundance N(HCO+)/ N(H2) = 3 × 10⁻⁹ to derive N(H2), the HCO+/H2 ratio being assumed to be constant in the gas. This value originates in the tight relationships that exist between HCO+ and OH (Liszt & Lucas 1996, 2000) or CH (Gerin et al. 2019), both of which are directly measured in optical/UV absorption spectra to have fixed abundances relative to H2 (Liszt 2007; Sonnentrucker et al. 2007; Sheffer et al. 2008; Weselak et al. 2009, 2010). The overall uncertainty in the abundance of HCO+ relative to H2 was estimated by Gerin et al. (2019) to be ± 0.2 dex; see their Table 4 giving relative abundances and uncertainties for a variety of molecules used as proxies for H2 at radio/sub-mm wavelengths.
3 Observational results
General properties of the sightlines observed here are given in Table 1, including HCO+ and CO optical depths integrated over the velocity range of the HCO+ absorption. Table 2 relates derived values of N(CO), N(HCO+) and N(H2) as shown in Figs. 4 and 5. Table 3 shows Gaussian decompositions of the CO profiles in those cases where it is justified, compared with the profile integral and results of Gaussian decomposition of the HCO+ profiles.
Figure 1 is a finding chart for the thirteen sources observed in HCO+ absorption, showing their placement on the sky with respect to the distributions of N(HI), N(DNM) and and the integrated CO brightness WCO as derived by Planck Collaboration Int. XXVIII (2015). Sightlines toward 6 of these were observed in CO, and CO and HCO+ profiles in these directions are shown in panels arranged around the periphery of the chart along with profiles toward J1723 that has detectable CO emission but was not observed in CO absorption in this work.
HCO+ and CO absorption profiles are shown in Fig. 2 for all the sources observed here. CO absorption was detected along all five of sightlines in the high-DNM group and not toward B1251. The sightline to J0942 has the strongest integrated CO absorption in total but the strongest single feature is at 4 km s−1 toward J1224. The detection of very weak CO absorption toward J1058 was only possible because of its very strong continuum flux.
The relative abundances of N(CO) and N(H2) are known to have very wide variations resulting from their sensitivity to resonant photodissocation (Fig. 4) so it is not surprising that the ratio of the integrated CO and HCO+ optical depths ranges from 0.7 to 7 among the sightlines measured here (Tables 1 and 3). A mild surprise is that CO absorption is so weak in the blue-shifted component having much stronger HCO+ absorption toward J0942. The NANTEN spectrum toward J0942 (Fig. 1) suggested the possible presence of CO emission overlapping the HCO+ absorption and with stronger emission to the blue, in the same sense as that of the HCO+ absorption. This work shows that the CO column density in the blue-shifted component toward J0942 is too small to support a CO detection in emission.
HCO+ H2 and CO column densities.
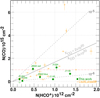 |
Fig. 5 CO and HCO+ column densities. Shown are results from this work (larger green filled squares) and the earlier observations of Liszt & Lucas (1998) (small orange circles). Integrated CO J = 1− 0 optical depths ϒCO have been converted to CO column density using the relationship between ϒCO and N(CO) shown in Fig. 3, N(CO) = 1.861 × 1015 cm−2 ϒCO1.131. Grey dashed shaded lines show fiducial values N(CO)/N(H2) = 10−6 and 10−5 assuming N(HCO+)/N(H2) = 3 × 10⁻⁹. The broad grey line at N(CO)/N(H2) = 5 × 10⁻⁶ divides the plot area into regions where XCO is larger or smaller than 2 × 10²⁰H2 (K km s−1)−1. The red dash-dotted line at N(CO) = 1015cm−2 shows the CO column density at which the integrated J = 1−0 emission brightness WCO = 1 K km s−1. |
4 CO and H2 column densities, CO brightness and CO-H2 conversion factor
4.1 ϒCO, N(CO) and WCO
Figure 3 shows the data of Liszt & Lucas (1998) leading to the regression relation that we use to convert the CO J = 1−0 integrated optical depth ϒCO to column density N(CO) as discussed in Sect. 2.5.
 (2)
(2)
Table 2 gives the results of using Eq. (2) and N(H2) = N(HCO+)/3 × 10−9 to derive N(CO) and N(H2) from our mm-wave CO and HCO+ absorption measurements. As a check on this procedure, Fig. 4 compares the present and prior mm-wave results for N(CO) and N(H2) with the larger sample of direct UV absorption line measurements of Sonnentrucker et al. (2007), Burgh et al. (2007) and Sheffer et al. (2008). Results for UV sightlines in the Chamaeleon region are noted in Fig. 4 (see Table 4) and are not exceptional.
The mm-wave results appear typical, not outliers, lending confidence to the assumed relative abundance of HCO+ that was used to derive N(H2). The mean relative abundance ⟨ N(CO)/N(H2) ⟩ ≃ 2.2–2.5 × 10⁻⁶ for the lines of sight observed here (Table 2) is very small compared to the expected fractional abundance of free gas-phase carbon, N(C)/N(H) ≃ 1.6 × 10⁻⁴ (Sofia et al. 2004), but still larger than found along many of the sightlines represented by UV absorption in Fig. 4. The older mm-wave results of Liszt & Lucas (1998) have CO and H2 column densities toward the upper ends of their respective distributions in Fig. 4, and stronger 13CO fractionation than is typically the case for the UV measurements (Liszt 2017).
In Fig. 5 we compare N(CO) and N(HCO+) from the present work with those in the earlier study of CO in emission and absorption (Liszt & Lucas 1998). The smaller sample of new data lacks individual features with column densities N(CO) > 2 × 1015 cm−2 or N(HCO+) > 1.5 × 1012 cm−2 as found in the older data but results for the two datasets largely overlap.
Gaussian decomposition of HCO+ and CO absorption.
Stars toward Chamaeleon studied in UV absorption.
4.2 The implied CO-H2 conversion factor
Also plotted in Fig. 5 are dashed lines corresponding to relative abundances N(CO)/N(H2) = 10−6 and 10−5, which follow directly from the relative abundance N(HCO+)/N(H2) = 3 × 10⁻⁹. An implied CO-H2 conversion factor can be derived when it is recognized that the integrated J = 1−0 emission profile brightness WCO is related to N(CO) as WCO/(1 K km s−1) = N(CO)/1015 cm−2 over a wide range of hydrogen number density in diffuse molecular gas (Liszt 2007, 2017), maintaining a high degree of linearity up to brightnesses WCO ≲5–10 K km s−1. In this casethe CO-H2 conversion factor depends only on the relative abundance N(CO)/N(H2) and the relative abundance N(CO)/N(H2) = 5 × 10⁻⁶ divides Fig. 5 (and the rest of the very local Universe) into regions where the CO-H2 conversion factor is larger or smaller than 2 × 1020 cm−2 (K km s−1)−1. That this value of the CO-H2 conversion factor is reached at such low CO/H2 relative abundances is a consequence of the very high brightnesses per molecule that occur when the rotational excitation is so strongly sub-thermal (Goldreich & Kwan 1974; Liszt et al. 2010).
Only in the red-shifted component toward J0942 is the implied CO-H2 conversion factor N(H2)/WCO below 2 × 10²⁰ H2 cm−2 (K km s−1)−1. We did not observe CO absorption toward J1723, but consideration of the detected CO emission and HCO+ absorption in this direction (Fig. 2) provides an interesting point of comparison. Directly integrating over the separate velocity ranges of the two kinematic components results in CO integrated brightnesses of WCO = 0.90 ± 0.14 and 1.36 ± 0.14 K km s−1 and HCO+ integrated optical depths  = 0.70 ± 0.03 and 0.81 ± 0.03 km s−1. Converting
  to N(HCO+) and N(H2) = N(HCO+) ∕ 3 × 10⁻⁹ leads to CO-H2 conversion factors N(H2)/WCO = 2.8 ± 0.5 and 2.2 ± 0.2 × 10²⁰ H2 cm−2 (K km s−1)−1 or N(H2)/WCO = 2.4 ± 0.3 × 10²⁰ H2 cm−2 (K km s−1)−1 overall.
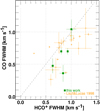 |
Fig. 6 CO and HCO+ line profile FWHM. Shown are results from this work (larger green filled squares) and the earlier observations of Liszt & Lucas (1998) (small orange circles). The dashed gray line represents equality of the FWHM. |
4.3 Kinematics of CO absorption features
In Figs. 4 and 5 we showed that the column densities of CO and HCO+ in the outskirts of Chamaeleon are like those previously observed along random lines of sight through the diffuse ISM generally and the same is true of the linewidths. In Table 3 we show the results of Gaussian decomposition of the HCO+ and CO line profiles that are shown in Fig. 2. In some cases the superior signal/noise of the HCO+ measurements allows fitting of wings and closely-separated components that is not feasible in CO. The plotted results represent only those features that can be identified and associated in both species and have been corrected by quadrature differencing of the FWHM and velocity resolution. The FWHM linewidths for CO are systematically smaller than those of HCO+ as shown in Fig. 6. The unweighted mean linewidths for the combined sample of new and old data are 0.87± 0.24 km s−1 for HCO+ and 0.72± 0.22 km s−1 for CO. This isnot necessarily expected since CO forms from the recombination of HCO+ in diffuse molecular gas (Glassgold & Langer 1976; Liszt 2007; Visser et al. 2009) and is initially cospatial with parent HCO+ molecules. HCO+ and OH profiles do not show comparable differences (Liszt & Lucas 2000). However, recombination of HCO+ to CO is sensitive to temperature while survival of the CO molecules after formation depends on shielding by H2, dust and other CO molecules (Draine & Bertoldi 1996; Visser et al. 2009; Sternberg et al. 2014; Liszt 2015), raising the possibility that regions with differing N(HCO+)/N(CO) exist within the gas and are superposed along the line of sight (Godard et al. 2009).
Linewidth differences among other chemical species are well-known in diffuse molecular gas. In optical spectra there is a sequence CH+, CH, CN from broader to narrower lines (Lambert et al. 1990; Crane et al. 1995; Pan et al. 2005) perhaps extending further to CO (Pan et al. 2005). At mm-wavelengths, CN absorption lines are narrower than those of HCN and HNC (Liszt & Lucas 2001; Godard et al. 2010) from which CN forms by photodissociation, and all the CN-bearing species have narrower lines than in HCO+. CH+ lines are typically much wider than those of other molecules, presumably because the formation of CH+ occurs through the strongly endothermicreaction of C+ and H2. HCO+ may keep a memory of this excess kinetic energy seen in the CH+ linewidth because it is such a close daughter product of CH+ (Godard et al. 2014).
Linewidth differences could arise as the result of the interplay between chemistry and gas dynamics in the diffuse molecular gas but not because CO molecules in the line wings of mm-wave absorption profiles are more susceptible to photodissociation. The shielding and self-shielding of H2 and CO arise from the continuous opacity of dust and the wings of strongly-damped H2 and CO electronic transitions at the column densities needed to form the observed amounts of CO, and the Doppler velocity distribution of CO or H2 molecules is not important to their survival.
In Paper I we noted a kinematic segregration in the Chamaeleon gas in the sense that the directions with less DNM and small N(H2) were seen in HCO+ only at v ≲2 km s−1 while the material with velocities 2–6 km s−1 had the preponderance of the HCN absorption, stronger HI emission and much more DNM and H2. We suggested that this might indicate the presence of slow shocks in the region. The CO data in Chamaeleon are too limited to draw firm conclusions but Fig. 7 shows a histogram of the distribution of line centroid velocity differences between HCO+ and CO for the new and old data. The mean difference is 0.1 km s−1, with a dispersion of 0.4 km s−1, indicating at most a very small systematic shift, and a small but physically significant dispersion.
Dynamical processes are important for the formation chemistry of the molecules we observe, most obviously for HCO+ whose observed abundance in diffuse molecular gas N(HCO+)/ N(H2) = 3 × 10⁻⁹ is nearly 100 times higher than would be expected from Langevin rates for the reaction of C+ + OH with their observed column densities (Van Dishoeck & Black 1986). Flower & Pineau des Forets (1998) and Lesaffre et al. (2013) discussd how a collection of slow shocks in magnetized diffuse gas could produce CH+, HCO+ and CO. Most models that boost the CH+ and/or HCO+ chemistry in diffuse gas tap the energy of an ion-neutral drift (Valdivia et al. 2017) which has a broad distribution ranging from 0.01 to 1 km s−1. Visser et al. (2009) drew on an earlier model of Federman et al. (1996), calculating molecular abundances at a suprathermal effective temperature determined by an Alven velocity of 3.5 km s−1.
The turbulent dissipation region (TDR) model of diffuse cloud chemistry (Godard et al. 2014) draws on earlier work (Falgarone et al. 1995; Joulain et al. 1998; Pety & Falgarone 2000) and forms CH+ and HCO+ in highly localized regions (vortices) where turbulent energy is dissipated and the ion-neutral drift is maximum. HCO+ subsequently relaxes and accumulates at the observed abundance in ambient gas where it thermalizes and recombines to CO. CO is subsequently fractionated by C+ exchange at ambient kinetic temperature (Liszt 2017) and both HCO+ and CO are observed with a degree of rotational excitation that is characteristic of the typical thermal pressures for the diffuse interstellar medium at large (Jenkins & Tripp 2011), as noted in Sect. 2.5. In such a model HCO+ recombines to CO more rapidly as it thermalizes, and the HCO+–CO linewidth difference is presumably a collateral effect.
Comparable linewidth differences are expected between HCO+ and other species that form by the recombination of ions, for instance HCN, HNC and CN that form from recombination of the as-yet undetected species HCNH+. Godard et al. (2010) observed smaller linewidths in HCN and HNC compared to HCO+ (Liszt & Lucas 2001 did not), and there is general agreement that the smallest linewidths have generally been observed in CN. We sought but did not detect CN except marginally toward J1224. The difference in the velocity profiles therefore appear to be related to the interplay of chemical and dynamical processes controlling the formation of molecules. To explore further the origin of the difference in velocity profiles more data are needed in specific regions where the large-scale orientation of the gas flows and magnetic field are homogeneous.
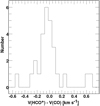 |
Fig. 7 Distribution of velocity differences between HCO+ and CO kinematic components from this work and the earlier observations of Liszt & Lucas (1998). The mean difference and its dispersion are 0.10 km s−1 ± 0.40 km s−1. |
5 Molecular, missing, and CO-dark gas
In Paper I we showed that HCO+ absorption lines traced important H2 reservoirs extending several parsecs beyond the CO-bright parts of the Chamaeleon molecular clouds. The H2 column densities inferred from the HCO+ data for a standard abundance ratio N(HCO+)/N(H2) = 3 × 10⁻⁹ could substantially account for the excess gas along the eight sight lines with large DNM column densities N(DNM) ≳2 × 1020 cm−2: diffuse H2 partially contributed to the DNM toward three directions and fully explained the DNM toward the five densest directions. In this section we extend some of the analysis from Paper I using an expanded, hybrid sample based on direct UV absorption measurements of N(H2) and N(CO).
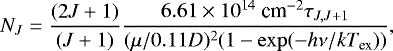
In Figs. 1 and 4 we noted the existence of UV absorption measurements of N(H2) and N(CO) toward stars of widely-varying distance seen toward Chamaeleon (Table 4). The nearer of these stars could in principle lie in front of some portion of the Chamaeleon gas but N(H2) is actually relatively high for the nearer objects. To complement the modest sample of sightlines observed with ALMA, we extracted the HI and DNM column densities and mm-wave CO brightness W(CO) toward these stars and combined this information with that for the mm-wave sightlines to produce Fig. 8 (like Fig. 6 in Paper I). In Fig. 8 we compare the total hydrogen column density obtained from the dust and gamma-ray data (the x-axis) to the total hydrogen column density N(HI) + 2N(H2) derived with and without the use of CO emission. In the left panel N(H2) =  WCO, while at right N(H2) is measured indirectly from HCO+ absorption lines for our ALMA data (circles) or directly from UV H2 absorption lines (crosses). The error bars on N(H2) at right assume ± 25% errors in N(H2) from the UV data and ± 58% errors on the N(HCO+)/N(H2) ratio (Liszt & Gerin 2016).
The colour coding with DNM column density shows that diffuse H2 can fully account for the DNM column densities over a range varying by at least a factor of six. One can also note from the difference in column density scales between the total and DNM gas that the broad atomic envelopes of the clouds contribute more gas along those sight lines than the diffuse H2 reservoirs. As in Paper I we infer that the DNM is mostly molecular while the gas overall is atomic, for the lines of sight we studied outside the CO-bright portions of the Chamaeleon complex.
6 Summary
Mm-wave CO absorption line measurements are well-suited to detecting or constraining the properties of dark medium and dark CO. The CO absorption measurements performed here answer the question of why the CO emission fails to represent N(H2) reliably in the outskirts of Chamaeleon. CO column densities and CO relative abundances are small in diffuse molecular gas around the HI → H2 transition as the resultof the CO chemistry at moderate reddening.
In Paper I we detected mm-wave J = 1−0 absorption from HCO+ and, less commonly, C2H and HCN, against thirteen compact extragalactic continuum sources seen toward the outskirts of the Chamaeleon HII region-molecular cloud complex. Only one of these directions (J1723) had a firm detection of CO J = 1−0 emission. Eight of the thirteen directions comprised a group with higher column densities of dark neutral medium and, as we showed, much higher molecular column densities. Converting the N(HCO+) to N(H2) with N(HCO+)/N(H2) = 3 × 10⁻⁹ we found that the DNM was mostly molecular even while the gas as a whole (in the observed directions) was predominantly atomic, with H-nuclei in atomic form.
In this work we observed CO J = 1−0 absorption lines toward six of the thirteen sightlines from Paper I, five of them in the higher-DNM group (Table 4 and Fig. 1). All five of these directions were detected in CO absorption (Fig. 2). Using a conversion between integrated J = 1−0 optical depth and CO column density derived earlier from observations of J = 1−0 and J = 2−1 absorption and emission along comparable sightlines (see Eq. (2) and Fig. 3, and Sect. 4) the observed CO column densities were found to lie in the range 4 × 1013 cm−2≲ N(CO) ≲1.2 × 1015 cm−2. This is generally below the expected limit of detectability of extant CO emission surveys given that an integrated CO brightness of WCO = 1 K km s−1 corresponds to N(CO) = 1015 cm−2 in diffuse molecular gas (Sect. 4.2). As noted in Paper I, the Planck CO emission foreground maps are, lamentably, hashed in the directions we observe, presumably as the result of point-source removal.
The ratio of J = 1−0 integrated optical depths in CO and HCO+ varies by almost an order of magnitude (Tables 1 and 2). Comparably-wide relative abundance variations are typical of sightlines at moderate reddening seen in UV absorption (Fig. 4) owing to the sensitivity of H2 and CO column densities to self- and mutual shielding and shielding by dust. To check on the conversions we employed to derive N(H2) and N(CO) we compared the radio- and UV-determined CO and H2 column densities in Fig. 4, finding the two types of measurements to yield consistent determinations of the run of CO and H2 column density.
In Fig. 5 we compared N(CO) and N(HCO+) for the new and existing mm-wave CO absorption measurements, leaving the conversion to N(H2) implicit. The datasets are consistent and there is nothing unusual about the Chamaeleon measurements, although they lack sightlines with HCO+ and CO column densities as high as some of those seen earlier (this is also apparent in Fig. 4). Given the equivalence of CO brightness and column density WCO ≃ N(CO) ∕ 1015 cm−2 in the diffuse molecular gas, the CO–H2 conversion factor N(H2)/WCO is linearly proportional to the CO relative abundance, and N(H2)/WCO ≤ 2 × 10²⁰ H2 cm−2 (K km s−1)−1 only when N(CO)/N(H2) ≥ 5 × 10⁻⁶. This is more than twice the mean value observed here: only the red-shifted line toward J0942 has a CO relative abundance high enough that the implied CO-H2 conversion factor is below N(H2)/ WCO = 2 × 10²⁰ H2 cm−2 (K km s−1)−1 (see Table 2 and Fig. 5). High values of the CO-H2 conversion factor N(H2)/WCO were also inferred in Paper I based on the limits to the CO brightness.
The mm-wave CO absorption line chemistry has not been revisited in the 20 yr since the observations of Liszt & Lucas (1998), which is somewhat surprising given the kind of information that is returned. For this reason, and owing to the modest number of sightlines we studied, we somewhat extended the discussion beyond the Chamaeleon region to a more general comparison of CO with HCO+ and H2. Beyond the column densities and abundances shown in Figs. 4 and 5, we noted (Fig. 6, Table 3) that the CO FWHM linewidths are consistently about 20% smaller than those seen in the progenitor HCO+ molecule (0.72 ± 0.22 and 0.87± 0.24 km s−1 respectively). A comparable difference is seen in CN-bearing species when compared with HCO+. There is also a ± 0.4 km s−1 dispersion in the difference of the centroid velocities of HCO+ and CO (Fig. 7). In Sect. 4 we discussed how the abundances and kinematics of HCO+, CO and other molecules arise from gas dynamical processes that enhance the formation rate of progenitor ions like CH+ and HCO+ and create inhomogeneities that cause linewidth differences.
In Fig. 8 we revisited part of the DNM analysis of Paper I, using a hybrid sample whereby we augmented the ALMA observations with the directly-determined H2 and CO column densities measured in UV absorption toward 8 bright stars seen toward the Chamaeleon region. As in Paper I we concluded that the DNM in the outskirts of the Chamaeleon complex is mostly molecular, with most H-nuclei in H2, while the gas overall is primarily atomic.
CO absorption profiles provide more information than just the column density, and consideration of a wider range of CO absorption line observations should help to elucidate the formation of molecules and the presence of DNM and the “dark” gas whose shadows we explored in this work.
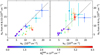 |
Fig. 8 Comparison of total column density of H-nuclei N(H) derived from the DNM analysis and from observable column densities. The variable plotted along the horizontal axis, N(H) = N(HI)|cham+N(DNM)+2WCO |


Acknowledgements
This paper makes use of the following new ALMA data: ADS/JAO.ALMA#2017.1.00227.S. ALMA is a partnership of ESO (representing its member states), NSF (USA) and NINS (Japan), together with NRC (Canada), NSC and ASIAA (Taiwan), and KASI (Republic of Korea), in cooperation with the Republic of Chile. The Joint ALMA Observatory is operated by ESO, AUI/NRAO and NAOJ. The National Radio Astronomy Observatory is a facility of the National Science Foundation operated under cooperative agreement by Associated Universities, Inc. This work was supported by the French program “Physique et Chimie du Milieu Interstellaire” (PCMI) funded by the Conseil National de la Recherche Scientifique (CNRS) and Centre National d’Etudes Spatiales (CNES). H.S.L. is grateful to the hospitality of the Observatoire de Paris and La Clemence (1204 CH Geneva) during the initial drafting of this manuscript. We thank the referee for helpful comments that served to clarify the discussion.
References
- Burgh, E. B., France, K., & McCandliss, S. R. 2007, ApJ, 658, 446 [NASA ADS] [CrossRef] [Google Scholar]
- Crane, P., Lambert, D. L., & Sheffer, Y. 1995, ApJS, 99, 107 [NASA ADS] [CrossRef] [Google Scholar]
- Draine, B. T., & Bertoldi, F. 1996, ApJ, 468, 269 [NASA ADS] [CrossRef] [EDP Sciences] [Google Scholar]
- Falgarone, E., Pineau Des, G., & Roueff, E. 1995, A&A, 300, 870 [NASA ADS] [Google Scholar]
- Federman, S. R., Rawlings, J. M. C., Taylor, S. D., & Williams, D. A. 1996, MNRAS, 279, L41 [NASA ADS] [CrossRef] [Google Scholar]
- Flower, D. R., & Pineau des Forets, G. 1998, MNRAS, 297, 1182 [NASA ADS] [CrossRef] [Google Scholar]
- Gerin, M., Liszt, H., Neufeld, D., et al. 2019, A&A, 622, A26 [NASA ADS] [CrossRef] [EDP Sciences] [Google Scholar]
- Glassgold, A. E., & Langer, W. D. 1976, ApJ, 206, 85 [NASA ADS] [CrossRef] [Google Scholar]
- Godard, B., Falgarone, E., & Pineau des Forêts, G. 2009, A&A, 495, 847 [NASA ADS] [CrossRef] [EDP Sciences] [Google Scholar]
- Godard, B., Falgarone, E., Gerin, M., Hily-Blant, P., & de Luca, M. 2010, A&A, 520, A20 [NASA ADS] [CrossRef] [EDP Sciences] [Google Scholar]
- Godard, B., Falgarone, E., & Pineau des Forêts, G. 2014, A&A, 570, A27 [NASA ADS] [CrossRef] [EDP Sciences] [Google Scholar]
- Goldsmith, P. F. 2013, ApJ, 774, 134 [NASA ADS] [CrossRef] [Google Scholar]
- Goldreich, P., & Kwan, J. 1974, ApJ, 189, 441 [NASA ADS] [CrossRef] [Google Scholar]
- Grenier, I. A., Casandjian, J.-M., & Terrier, R. 2005, Science, 307, 1292 [NASA ADS] [CrossRef] [PubMed] [Google Scholar]
- Jenkins, E. B., & Tripp, T. M. 2011, ApJ, 734, 65 [NASA ADS] [CrossRef] [Google Scholar]
- Joulain, K., Falgarone, E., Des Forets, G. P., & Flower, D. 1998, A&A, 340, 241 [NASA ADS] [Google Scholar]
- Kalberla, P. M. W., & Haud, U. 2015, A&A, 578, A78 [NASA ADS] [CrossRef] [EDP Sciences] [Google Scholar]
- Lambert, D. L., Sheffer, Y., & Crane, P. 1990, ApJ, 359, L19 [NASA ADS] [CrossRef] [Google Scholar]
- Lesaffre, P., Pineau des Forêts, G., Godard, B., et al. 2013, A&A, 550, A106 [NASA ADS] [CrossRef] [EDP Sciences] [Google Scholar]
- Liszt, H. S. 2007, A&A, 476, 291 [NASA ADS] [CrossRef] [EDP Sciences] [Google Scholar]
- Liszt, H. S. 2015, ApJ, 799, 66 [NASA ADS] [CrossRef] [Google Scholar]
- Liszt, H. S. 2017, ApJ, 835, 138 [NASA ADS] [CrossRef] [Google Scholar]
- Liszt, H. S., & Gerin, M. 2016, A&A, 585, A80 [Google Scholar]
- Liszt, H. S., & Lucas, R. 1996, A&A, 314, 917 [NASA ADS] [Google Scholar]
- Liszt, H. S., & Lucas, R. 1998, A&A, 339, 561 [NASA ADS] [Google Scholar]
- Liszt, H. S., & Lucas, R. 2000, A&A, 355, 333 [NASA ADS] [Google Scholar]
- Liszt, H., & Lucas, R. 2001, A&A, 370, 576 [NASA ADS] [CrossRef] [EDP Sciences] [Google Scholar]
- Liszt, H. S., & Pety, J. 2012, A&A, 541, A58 [NASA ADS] [CrossRef] [EDP Sciences] [Google Scholar]
- Liszt, H. S., Pety, J., & Lucas, R. 2010, A&A, 518, A45 [NASA ADS] [CrossRef] [EDP Sciences] [Google Scholar]
- Liszt, H., Gerin, M., & Grenier, I. 2018, A&A, 617, A54 [NASA ADS] [CrossRef] [EDP Sciences] [Google Scholar]
- Pan, K., Federman, S. R., Sheffer, Y., & Andersson, B.-G. 2005, ApJ, 633, 986 [NASA ADS] [CrossRef] [Google Scholar]
- Pety, J., & Falgarone, É. 2000, A&A, 356, 279 [NASA ADS] [Google Scholar]
- Planck Collaboration XI. 2014, A&A, 571, A11 [NASA ADS] [CrossRef] [EDP Sciences] [Google Scholar]
- Planck Collaboration Int. XXVIII. 2015, A&A, 582, A31 [NASA ADS] [CrossRef] [EDP Sciences] [Google Scholar]
- Remy, Q., Grenier, I. A., Marshall, D. J., & Casandjian, J. M. 2018, A&A, 611, A51 [NASA ADS] [CrossRef] [EDP Sciences] [Google Scholar]
- Schlegel, D. J., Finkbeiner, D. P., & Davis, M. 1998, ApJ, 500, 525 [NASA ADS] [CrossRef] [Google Scholar]
- Sheffer, Y., Rogers, M., Federman, S. R., et al. 2008, ApJ, 687, 1075 [NASA ADS] [CrossRef] [Google Scholar]
- Sofia, U. J., Lauroesch, J. T., Meyer, D. M., & Cartledge, S. I. B. 2004, ApJ, 605, 272 [NASA ADS] [CrossRef] [Google Scholar]
- Sonnentrucker, P., Welty, D. E., Thorburn, J. A., & York, D. G. 2007, ApJS, 168, 58 [NASA ADS] [CrossRef] [Google Scholar]
- Sternberg, A., Le Petit, F., Roueff, E., & Le Bourlot, J. 2014, ApJ, 790, 10 [NASA ADS] [CrossRef] [MathSciNet] [Google Scholar]
- Valdivia, V., Godard, B., Hennebelle, P., et al. 2017, A&A, 600, A114 [NASA ADS] [CrossRef] [EDP Sciences] [Google Scholar]
- Van Dishoeck, E. F., & Black, J. H. 1986, ApJS, 62, 109 [NASA ADS] [CrossRef] [Google Scholar]
- Visser, R., van Dishoeck, E. F., & Black, J. H. 2009, A&A, 503, 323 [NASA ADS] [CrossRef] [EDP Sciences] [Google Scholar]
- Weselak, T., Galazutdinov, G., Beletsky, Y., & Krełowski, J. 2009, A&A, 499, 783 [NASA ADS] [CrossRef] [EDP Sciences] [Google Scholar]
- Weselak, T., Galazutdinov, G. A., Beletsky, Y., & Krełowski, J. 2010, MNRAS, 402, 1991 [NASA ADS] [CrossRef] [Google Scholar]
All Tables
All Figures
|
Fig. 1 ALMA results in the Chamaeleon complex. Center: RGB image with N(HI) in blue, N(DNM) in green and Nanten CO emission brightness in red. The locations of the 13 ALMA sources studied in Paper I are marked as squares, hatched for the 5 directions where CO absorption was detected in this work. The positions of 8 stars with measured values of N(H2) and N(CO) in UV absorption (Table 3) are marked by x’s. Shown around the outside are HCO + (grey, shaded) andCO (red) absorption and CO emission profiles (blue) from NANTEN on a different vertical scale as noted at right in each outer panel. CO absorption was not observed toward J1723 and was sought but not detected or plotted toward B1251. |
| In the text | |
|
Fig. 2 ALMA HCO+ and 12CO absorption profiles for the six sources observed here. The HCO+ profile from Paper I is shown shaded in grey, the 12CO J = 1−0 profile from this work is shown in red. |
| In the text | |
|
Fig. 3 The relationship between integrated CO J = 1−0 optical depth and N(CO) for the data of Liszt & Lucas (1998) who observed J = 1−0 and J = 2−1 CO emission and absorption along comparable sightlines. The power-law fit is N(CO) = 1.861 × 1015 cm−2 ϒCO1.131 where ϒCO = ∫ τ0,1(CO) dν in units of km s−1. |
| In the text | |
|
Fig. 4 H2 and CO column densities from UV and radio absorption spectra. Shown are UV absorption line measurements from Sonnentrucker et al. (2007), Burgh et al. (2007) and Sheffer et al. (2008) (downward-pointing triangles), mm-wave results from Liszt & Lucas (1998) (small orange circles), and results from this work (green filled squares). Some informative upper limits to UV measurements are shown in red. The mm-wave results assume N(H2) = N(HCO+)/3 × 10−9 and the present results use Eq. (2) to derive N(CO). UV absorption sightlines in Chamaeleon are marked by blue asterisks, see Table 4. Grey dashed lines show the locii of relative abundances N(CO)/N(H2) as indicated. Only sighlines with N(CO) > 1015 cm−2 are observable in present wide-field CO emission surveys. |
| In the text | |
|
Fig. 5 CO and HCO+ column densities. Shown are results from this work (larger green filled squares) and the earlier observations of Liszt & Lucas (1998) (small orange circles). Integrated CO J = 1− 0 optical depths ϒCO have been converted to CO column density using the relationship between ϒCO and N(CO) shown in Fig. 3, N(CO) = 1.861 × 1015 cm−2 ϒCO1.131. Grey dashed shaded lines show fiducial values N(CO)/N(H2) = 10−6 and 10−5 assuming N(HCO+)/N(H2) = 3 × 10⁻⁹. The broad grey line at N(CO)/N(H2) = 5 × 10⁻⁶ divides the plot area into regions where XCO is larger or smaller than 2 × 10²⁰H2 (K km s−1)−1. The red dash-dotted line at N(CO) = 1015cm−2 shows the CO column density at which the integrated J = 1−0 emission brightness WCO = 1 K km s−1. |
| In the text | |
|
Fig. 6 CO and HCO+ line profile FWHM. Shown are results from this work (larger green filled squares) and the earlier observations of Liszt & Lucas (1998) (small orange circles). The dashed gray line represents equality of the FWHM. |
| In the text | |
|
Fig. 7 Distribution of velocity differences between HCO+ and CO kinematic components from this work and the earlier observations of Liszt & Lucas (1998). The mean difference and its dispersion are 0.10 km s−1 ± 0.40 km s−1. |
| In the text | |
|
Fig. 8 Comparison of total column density of H-nuclei N(H) derived from the DNM analysis and from observable column densities. The variable plotted along the horizontal axis, N(H) = N(HI)|cham+N(DNM)+2WCO |
| In the text | |
Current usage metrics show cumulative count of Article Views (full-text article views including HTML views, PDF and ePub downloads, according to the available data) and Abstracts Views on Vision4Press platform.
Data correspond to usage on the plateform after 2015. The current usage metrics is available 48-96 hours after online publication and is updated daily on week days.
Initial download of the metrics may take a while.