Fig. 1
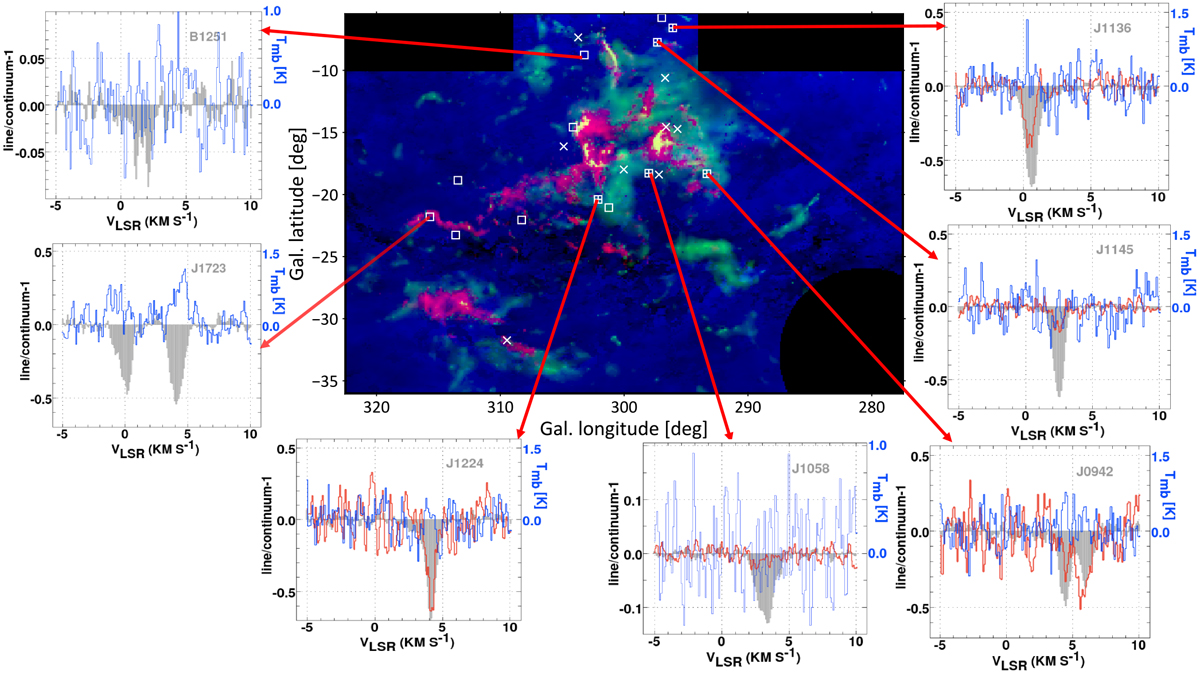
ALMA results in the Chamaeleon complex. Center: RGB image with N(HI) in blue, N(DNM) in green and Nanten CO emission brightness in red. The locations of the 13 ALMA sources studied in Paper I are marked as squares, hatched for the 5 directions where CO absorption was detected in this work. The positions of 8 stars with measured values of N(H2) and N(CO) in UV absorption (Table 3) are marked by x’s. Shown around the outside are HCO + (grey, shaded) andCO (red) absorption and CO emission profiles (blue) from NANTEN on a different vertical scale as noted at right in each outer panel. CO absorption was not observed toward J1723 and was sought but not detected or plotted toward B1251.
Current usage metrics show cumulative count of Article Views (full-text article views including HTML views, PDF and ePub downloads, according to the available data) and Abstracts Views on Vision4Press platform.
Data correspond to usage on the plateform after 2015. The current usage metrics is available 48-96 hours after online publication and is updated daily on week days.
Initial download of the metrics may take a while.