| Issue |
A&A
Volume 699, July 2025
|
|
|---|---|---|
| Article Number | A17 | |
| Number of page(s) | 19 | |
| Section | Interstellar and circumstellar matter | |
| DOI | https://doi.org/10.1051/0004-6361/202453182 | |
| Published online | 27 June 2025 | |
CO, CS, HCO, HCO+, C2H, and HCN in the diffuse interstellar medium
1
National Radio Astronomy Observatory,
520 Edgemont Road,
Charlottesville,
VA
22903,
USA
2
LERMA, Observatoire de Paris, PSL Research University CNRS Sorbonne Université,
France
★ Corresponding authors: This email address is being protected from spambots. You need JavaScript enabled to view it.
; This email address is being protected from spambots. You need JavaScript enabled to view it.
Received:
26
November
2024
Accepted:
16
May
2025
Abstract
Context. Radio frequency molecular absorption lines appear along sight lines with AV well below 1 mag, revealing the presence of H2 in diffuse gas even when λ2.6mm CO emission is absent.
Aims. We discuss absorption lines of HCO+, C2H, HCN, CS, and HCO in a larger sample (88 sight lines) than was available before.
Methods. We observed millimeter-wave absorption at the Institut de radioastronomie millimetrique (IRAM) and Atacama Large Millimeter/submillimeter (ALMA) interferometers over the past 30 years and gathered the results for to compare with observations of HCO+ and CO emission taken at the Arizona Radio Observatory (ARO) KP12m and IRAM 30m telescopes.
Results. We detected HCO+ along 72 of 86 sight lines where it was observed, C2H along 53 of 76 sight lines, and HCN along 38 of 57 sight lines. C2H is ubiquitous, and N(C2H)/N(HCO+) increases at smaller EB−V and smaller N(HCO+), but C2H absorption is intrinsically weaker, which lowers the number of sight lines with a low column density along which it was detected. The dense-gas tracer HCN was uniformly detected down to N(H2) = 1020 cm−2, with little change in the relative abundance of N(HCN)/N(HCO+) ≈ 1.25. HCO was detected along only 4 of 46 sight lines that were newly observed at ALMA because its lines are intrinsically weak, but HCO is ubiquitous in the interstellar medium with N(HCO)/N(HCO+) = 1/3 or N(HCO)/N(H2) = 10−9. CS was not seen in the 13 directions where it was newly observed, which are all in Chamaeleon. The line widths of HCN features are (like those of CO) narrower than those of matching features observed in HCO+, and those of C2H are broader. HCO+ emission is commonly observed at (log) levels −2 ± 0.3 dex with respect to CO emission. The comparison of HCO+ emission and absorption along 7 sight lines yielded a typical HCO+ excitation temperature of 2.76 K and total neutral hydrogen number densities n(H) of ≈50–200 cm−3.
Key words: ISM: clouds / ISM: lines and bands / ISM: molecules / ISM: structure
© The Authors 2025
 Open Access article, published by EDP Sciences, under the terms of the Creative Commons Attribution License (https://creativecommons.org/licenses/by/4.0), which permits unrestricted use, distribution, and reproduction in any medium, provided the original work is properly cited.
This article is published in open access under the Subscribe to Open model. This email address is being protected from spambots. You need JavaScript enabled to view it. to support open access publication.
1 Introduction
In several recent papers (Liszt et al. 2018, 2019; Liszt & Gerin 2023b), we used the Atacama Large Millimeter/Submillimeter Array (ALMA) observations of millimeter-wave HCO+ and CO absorption to demonstrate the molecular character of the dark neutral medium (DNM) that is present at the HI-H2 transition in diffuse or translucent interstellar gas (Grenier et al. 2005; Planck Collaboration Int. XXVIII 2015; Remy et al. 2017, 2018). Gas in the DNM is inferred to be present from far-infrared (FIR) dust emission and γ-ray emission but is imperfectly traced and largely invisible in λ21 cm HI and λ2.6 mm CO emission. In our work, sight lines with a low CO column density that lack detectable CO emission showed HCO+ absorption when the reddening exceeded the known threshold EB−V ≳ 0.08 mag (Savage et al. 1977; Liszt & Gerin 2023a) for observing H2 fractions ***(eq1)*** . With a few exceptions that imply a possible saturation of the λ21cm HI profile, the newly inferred H2 column densities N(H2) = N(HCO+)/3 × 10−9 closely matched the amount of DNM.
In the course of these observations along 13 sight lines in Chamaeleon and 33 sight lines in the Galactic anticenter, we also used the prodigious data-gathering abilities of ALMA to observe absorption from other species that were previously detected in diffuse gas, C2H (Lucas & Liszt 2000; Liszt et al. 2012), HCN (Liszt & Lucas 2001), CS (Lucas & Liszt 2002), HCO (Liszt et al. 2014), and H2CO (Nash 1990; Lucas & Liszt 1996; Liszt et al. 2006). We discuss these associated observations here. In combination with ALMA observations of 4 sight lines at low latitude in the inner Galaxy (Gerin & Liszt 2017; Liszt & Gerin 2018) and the previously published absorption data from the IRAM 30m telescope and Plateau de Bure Interferometer (PdBI), we discuss observations along 86 sight lines in the most commonly observed species HCO+, 76 in C2H and 57 in HCN. HCO is a ubiquitous species with weak absorption (Liszt et al. 2014) that was detected along all 4 of the 46 sight lines at which it was expected based on the ac achieved rms noise levels.
Far fewer (25) sight lines were observed in total in CS after our failure to detect CS absorption along the 13 sight lines in Chamaeleon within the integration times that sufficed to detect HCO+ and C2H. No new detections of CS are presented here, and, as discussed below, the new upper limits on CS are not significant because the molecular hydrogen column densities that characterize the observed sight lines are low. A comparison of absorption line observations of CS and H2CO toward B0355+508 recently showed that the relative abundance of CS increases in presumably denser gas with a smaller electron fraction, where a substantial fraction of ionized carbon has recombined to neutral atomic carbon (Gerin et al. 2024). This suggests a role of neutral carbon in the formation of CS along with recombination of HCS+ that was also inferred (Lucas & Liszt 2002). CS J=2–1 emission from diffuse gas is bimodal with respect to HCO+ emission and abruptly increases in brightness when the integrated brightness of CO exceeds 10 K-km s−1 (Liszt 2020).
Section 2 summarizes the observational material we considered. Section 3 discusses the properties of the sample in the broader Galactic context and summarizes the abundance relations among HCO+, C2H, HCN, CS, and HCO. Section 4 compares the line widths of Gaussian kinematic components fit to HCO+, C2H and HCN. In Section 5, we use the HCO+ and CO emission to derive HCO+ excitation temperatures and hydrogen number densities in the host gas and to relate the H2 sampled in HCO+ absorption to the CO emission brightness, the 12CO/13CO brightness ratio, and the CO-H2 conversion factor. These quantities are commonly used to characterize the gas. Section 6 presents our summary.
2 Observations and data sources
The dataset we discuss here is a combination of older and newer observations, as noted in Table A.1. The older absorption line work is from the IRAM PdBI and NOEMA interferometers, and the older CO and HCO+ emission line profiles were taken at the previous-generation ARO 12m telescope on Kitt Peak. The newer observations of the absorption line were taken at ALMA, and the newer CO and HCO+ emission profiles were taken at the IRAM 30m telescope. The older data and some of the newer data have been described in earlier work cited here. The portions of the current dataset that have not been published previously are the 87–98 GHz ALMA absorption profiles of HCO, HCN, C2H and CS, and the profiles of 13CO and HCO+ emission that were taken in the course of our recent work to characterize the DNM, as noted in the Introduction.
2.1 Absorption line spectra
As in our earlier work, the new ALMA absorption line profiles were taken from the continuum-peak pixels of the spectral line datacubes from the standard pipeline product for the various species, and they were normalized by the continuum flux in the appropriate continuum map of the spectral window. The channel spacing and approximate spectral resolution of the ALMA data were 30.5 and 61.0 kHz, or 0.102 and 0.205 km s−1 respectively, at the HCO+ rest frequency 89.1885 GHz. All directions in the Galactic anticenter were observed for the same time, which resulted in strongly varying rms line/continuum sensitivities.
We newly observed the F=2–1 and F=1–0 hyperfine components of the N=1–0, J=3/2–1/2 transition of C2H whose strongest hyperfine component (F=2–1) is at 87.317 GHz. The observed components included 5/8 of the total integrated line strength of the N=1–0 J=3/2–1/2 transition. We define the total as ϒCCH. N(C2H) = 2.71 × 1013 cm−2ϒCCH as in our earlier survey of C2H absorption (Lucas & Liszt 2000), where all hyperfine components were observed. The spectra of C2H are shown in Figure C.1.
As in earlier work (Liszt & Lucas 2001), we observed the J=1–0 transition of HCN, whose strongest hyperfine component is at 88.632 GHz, and we derived N(HCN) = 1.89 × 1012 cm−2 ϒHCN where ϒHCN is the integrated optical depth summed over all three hyperfine components. The spectra of HCN are shown in Figure D.1.
The line-of-sight properties and measured absorption line quantities are given in Table B.1 for HCO+, HCN, and C2H. The fluxes in this table are averages of the almost equal fluxes in the three spectral windows. Upper limits are the 3σ values measured over the span of the HCO+ line, when given. In the five cases when HCO+ was not observed or not detected, they are given over an arbitrary 3 km s−1 interval. No absorption from CS was reliably detected in our observations of Chamaeleon. We therefore did not observe CS in the Galactic anticenter.
2.2 Emission line spectra
The IRAM 30m emission profiles have a channel spacing and approximate spectral resolution of 48.8 and 97.7 kHz, or 0.164 and 0.33 km s−1 at the HCO+ rest frequency.
The HCO+ profiles we show are averages of spectra displaced by 1.2 HPBW = 30″ from the continuum source in each of the four cardinal directions, as discussed in Appendix F. This was necessary because the emitted and absorbed fluxes are comparable, and no pure emission spectrum was obtained toward the continuum at the 30m telescope. This is not a concern for much brighter CO lines.
As before, the emission results are presented on the mainbeam antenna temperature scale that is native to the 30m telescope.
2.3 Atomic and molecular hydrogen column densities
The λ21cm HI column densities were derived from the Leiden, Argentine, and Bonn (LAB) All-Sky HI survey Kalberla et al. (2005) in the optically thin limit as N(HI) = 1.823 × 1018 cm−2 WHI, where WHI is the λ21cm HI emission line profile integral in units of K-km s−1.
As is common practice (see Gerin et al. 2019), we derived the H2 column densities as N(H2) = N(HCO+)/3 × 10−9 and N(HCO+) = 1.10 × 1012 cm−2 ϒHCO+ where ϒHCO+ is the integrated optical depth of the J=1–0 HCO+ absorption line, which corresponds to a permanent dipole moment of µ = 3.89 Debye for HCO+. Much of our earlier work (e.g. Lucas & Liszt 1996) employed a higher permanent dipole moment of µ = 4.07 Debye and derived ≈10% lower N(HCO+) for a given ϒHCO+.
2.4 Conventions
The velocities we present with the spectra were taken with respect to the kinematic definition of the local standard of rest. We defined N(H) as the column density of H nuclei detected in their neutral atomic and molecular form, N(H) = N(HI)+2N(H2). The molecular hydrogen fraction ***(eq2)*** . The integrated absorption of the HCO+ profile in units of km s−1 is denoted by ϒHCO+ and similarly for other species. The integrated emission of the J=1–0 CO line is denoted by WCO in units of K-km s−1, and the CO-H2 conversion factor N(H2)/WCO is denoted by XCO.
Where reference is made to a typical Galactic or standard CO-H2 conversion factor, the value N(H2)/WCO = 2 × 1020 cm−2/(1 K-km s−1) should be understood, as summarized in Table E.1 of Remy et al. (2017). Where we refer to optical reddening, the values cited were taken from the work of Schlegel et al. (1998).
Where the contributions of individual datasets are noted in the figures, the rubric PdBI denotes results taken from the earlier surveys of HCO+ (Lucas & Liszt 1996), C2H (Lucas & Liszt 2000), HCN Liszt & Lucas (2001), and CS (Lucas & Liszt 2002). The rubric Chamaeleon refers to new data taken incidental to the DNM studies of Liszt et al. (2018, 2019), and Inner Galaxy refers to the data of Gerin & Liszt (2017) and Liszt & Gerin (2018). New results incidental to DNM studies in the Galactic anticenter (Liszt & Gerin 2023b) use the rubric Outer Galaxy.
2.5 Distances and velocity assignments
Approximate cloud distances derived from the Gaia stellar reddening surveys are available for sight lines in or near wellknown cloud complexes that have been specifically targeted, for instance, 180–200 pc in Chamaeleon (Voirin et al. 2018; Yan et al. 2019; Zucker et al. 2019) and 140 pc in Taurus (Yan et al. 2019; Zucker et al. 2019). There are two isolated sight lines (Liszt & Pety 2012; Liszt 2020) in the general vicinity of the high-latitude cloud MBM 53 at 250 pc (Sun et al. 2021), and the gas toward BL Lac is a few degrees away from the Lacerta region identified at 500 pc by Yan et al. (2019); Zucker et al. (2019).
The 3D extinction maps of Lallement et al. (2022) show the run of extinction with distance along our specific sight lines. The relatively large jumps in extinction associated with molecular gas uniquely associate dust structures with the absorption line velocity in the simpler cases, even in the absence of CO emission. Conversely, structure in the run of extinction with distance may help us to understand kinematic substructure in the absorption line profiles. This subject will be discussed in a future contribution.
3 The sample
The sample is an amalgamation of datasets that were taken over the course of nearly 30 years for various purposes, at instruments that overlap only partially in their sky coverage. The PdBI surveys of HCO+ (Lucas & Liszt 1996) and C2H (Lucas & Liszt 2000) contained flux-limited samples that were augmented with a few sources of particular interest, as viewed from the perspective of the Northern Hemisphere, and the PdBI data for HCN and CS were much more limited. The ALMA data in Chamaeleon were complete in flux over a very particular sky region. The newer ALMA data in the outer Galaxy were derived from a serendipitous sample of sight lines that were previously studied to derive their DNM content. The properties and biases of the sample are discussed in this section.
3.1 Galactic-scale properties
Figure 1 shows the galactic-scale properties of our sample. The gas and dust column densities are plotted against sin(|b|), which is proportional to the nominal path length through a planeparallel stratified Galactic disk. The numerical values derived from these plots are given in Table 1. In the top left corner in Figure 1, the reddening EB−V along individual sight lines (Schlegel et al. 1998) is plotted, together with the all-sky average at each latitude calculated at increments of Δ sin(|b|) = 0.01. The regression line for the sample has a power-law slope of −1.00 ± 0.08, which is appropriate for a plane-parallel stratified medium, but the Galaxy per se progressively departs from this geometry for |b| ≳ 20°. The sample values of EB−V lie above the Galactic average at all latitudes and do not show the same steep decline until |b| ≳ 44°. Thus, the sample is noticeably rich in dust and gas. We also mark the sight lines without HCO+ detections. These sight lines track the Galactic average more closely and mostly lie below the regression line.
Figure 1 in the top right corner shows a similar plot for the HI profile integral converted into column density N(HI), as described in Section 2.3. In this plot, the sample mean N(HI) follows the Galactic average for |b| ≲ 15° and departs less from the Galactic average up to about 30° than EB V. When the departure of the sample from the Galactic average is smaller in N(HI) than in EB−V, the sample is likely to be rich in molecular gas. In contrast to the behavior of EB−V, the sample sight lines without a detection of HCO+ have typical sample values of N(HI) up to very high latitudes, where the sample values of EB−V decrease. It is tempting to identify the missing EB −V with the absent H2.
Figure 1 shows the Galactic-scale distribution of two quantities measured in this study in the bottom panel, N(H2) = N(HCO+)/3 × 10−9 at the left (where the upper limits on HCO+ were included in the calculation of the regression line at their displayed values), and WCO at the right. The HCO+ column density and CO emission brightness show more scatter owing to the sensitivity of the H2 and CO formation to local gas properties. The sight lines without a HCO+ detections fall well below the regression line at the left, but are well mixed in the general data population. In any case, HCO+ was not detected along any sight line above 44°, corresponding to sin(44°) = 0.7.
Figure 1 shows in the bottom right panel the data for the line profile integral of CO emission WCO. In this plot, the upper limits on CO emission fall far below the weakest detections. This differs from the plot in the bottom left panel, where the upper limits on the HCO+ absorption are at levels at which HCO+ is commonly detected. We generally failed to observe any CO emission at levels WCO ≲ 0.2 K-km s−1. No CO emission was detected along sight lines without a detection of HCO+. The sight lines without CO emission when HCO+ absorption is detected are possibly more interesting.
The results in Figure 1 indirectly show that the molecular fraction of the diffuse gas is substantial (1/4–1/3), the applicable CO-H2 conversion factor is near the standard Galactic value (Section 2.4), and even very low levels of CO emission can imply significant molecular fractions in the ISM.
The HI column through the Galactic disk vertically at the solar radius is usually quoted as N(HI) ≈3 × 1020 cm−2, which is slightly below the 90° intercept of the regression line for N(HI) in the upper right panel in Figure 1, ≈4 × 1020 cm−2. By comparison, the 90° intercept of the regression line for N(H2) in the lower left panel is N(H2) ≈0.6 × 1020 cm−2, implying ***(eq3)*** .
.
The vertical intercept of the regression line in the lower left panel is at WCO = 0.245 K-km s−1, compared to WCO = 0.235 K-km s−1 derived from the smaller sample of older data cited here (Liszt et al. 2010). In comparison with the result in the lower left panel for H2, the implied CO-H2 conversion factor is 0.63 × 1020 cm−2/(0.245K-km s−1) = 2.57 × 1020 cm−2/(K-km s−1).
If we were to look at the Milky Way vertically from outside the solar circle, the CO brightness would be 2 × 0.245 K-km s−1 = 0.49 K-km s−1. This is small compared to the brightness of disks in external galaxies such as M51 (Bigiel et al. 2016), but it is about half of the face-on brightness of the Milky Way at the solar circle, 0.8 K-km s−1 (Liszt et al. 2010). The diffuse molecular gas causes about half of the molecular hydrogen in the ISM near the Sun. An integrated brightness of 1 K-km s−1 is equivalent to a H2 mass of 4.1 M⊙ pc−2 using the CO-H2 conversion factor derived above.
3.2 Molecules mixed in the Galactic gas and dust
Figure 2 plots the column densities of HCO+, C2H, HCN, and CS against reddening EB−V. HCO+ is the most commonly detected molecule considered here, but neither it nor any other molecules were found at EB−V < 0.07 mag where the molecular hydrogen fraction ***(eq4)*** is generally small in the ISM (Bohlin et al. 1978). The precise EB–V locus of the onset of appreciable values of ***(eq5)***
 is somewhat uncertain (Liszt & Gerin 2023a).
Table 3 shows the fractions of detections of HCO+, C2H, HCN, CS, and HCO with EB−V (in decreasing order of the number of detections) and with the choice of a 2σ or 3σ confidence level. EB−V = 0.0675 mag is the lowest reddening at which any absorption was detected in HCO+. HCO+ is detected two-thirds of the time at EB−V ≤ 0.125 mag or AV ≤ 0.4 mag, and the detection rates of HCO+ are almost entirely unaffected by the choice of confidence level. The ubiquity of HCO+ absorption enhances the ability of detecting other species by providing a guide as to which sight lines harbor molecular gas and the velocity range over which molecular absorption or emission in other species is expected.
C2H is the second most commonly detected molecule. Its lower detection rate (compared to HCO+) results more from a lower sensitivity than from a narrower, less ubiquitous distribution in the Galactic gas. Overall, C2H was detected in two-thirds of the directions in which it was observed.
The so-called high-density tracer HCN is detected at least half the time when EB−V ≳ 0.125 mag or AV≳ 0.4 mag and it is detected along two-thirds of the sight lines where it was observed. This is almost as frequently as C2H. CS, another high-density tracer, was the least often detected species of the four species shown in Figure 2 for reasons that are discussed in Section 3.4.
The numerical values of statistical properties and power-law regression fits derived from the plots in Figure 2 are given in Table 2. HCO+ has a power-law slope versus EB−V of 1.03 ± 0.11 in Figure 2, but the Galactic anticenter sample shows a very rapid increase in HCO+ with EB–V within the overall envelope of the data. The mixing of gas and dust over long sight lines with high reddening near the Galactic plane in the inner-Galaxy sample tends to drive the overall behavior toward the unit slope, while the abundances are more likely to be dominated by localized cloud-level behavior when the EB−V is modest.
HCN alone shows a power-law slope higher than one overall, 1.35 ± 0.10. The slope of the power-law fit to N(C2H), 0.83 ± 0.10, is noticeably shallower than that of HCO+. This indicates an increase in N(C2H)/N(HCO+) at smaller EB−V that was reported earlier (Lucas & Liszt 2000). The plot in the lower right panel shows that CS is lower at EB−V ≲ 0.6 mag than in the regression line for the detected lines of sight.
The abundances are broadly consistent with earlier results, but they are subject to several influences, including modern use of a smaller permanent dipole moment for HCO+, 3.89 versus 4.07 Debye. This leads to an increase of 9.4% in N(HCO+) and to a smaller abundances relative to HCO+ and H2 for other species. Where the abundances have a nonlinear relation, the derived average relative abundances depend on the makeup of the samples, as discussed in Section 3.4.
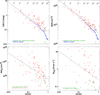 |
Fig. 1 Galactic-scale properties of the sample. We plot against sin(|b|) EB−V (top left), N(HI) (top right), N(H2) = N(HCO+)/3 ×10−9 (bottom left), and WCO, the line profile integral of the CO J=1–0 emission. The sight lines that were not detected in HCO+ absorption are shown as smaller green symbols in the upper two panels. The smaller green symbols in the lower panels are the 3σ upper limits on the plotted quantity. The solid line in each panel is a regression line: A plane-parallel vertically stratified Galactic gas layer would exhibit a power-law slope of –1. We also show averages at intervals of 0.01 in sin(|b|) in blue at the top. A legend marking the values of the Galactic latitude is inset near the top of the upper two panels. The values for the statistical parameters and the regression fits are given in Table 1. |
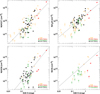 |
Fig. 2 Molecular column densities plotted against EB−V from Schlegel et al. (1998). The associated datasets are indicated (see Section 2.4). The solid line in each panel is a regression line for the sight lines with detections of both plotted quantities. The values for the statistical parameters and the regression fits are given in Table 2, and the statistical detection rates are given in Table 3. |
Detection rates as they vary with EB−Vand confidence level.
3.3 HCO
This work and the recent detection of HCO toward J1851+0035 by Narita et al. (2024) provided the first observations of HCO in diffuse gas since the original detection by Liszt et al. (2014). HCO is a widely distributed species whose lowest rotational transition is spread over four hyperfine components with LTE line strengths in a 4:2:2:1 ratio. The strongest hyperfine component at 86670.76 MHz was observed to be 2% as strong as HCO+ (Liszt et al. 2014), meaning that HCO can only be detected at the 2σ level in directions where HCO+ is detected with a signal-to-noise ratio of 100 or more. There were 4 directions like this among the 46 observations in which HCO was observed in this work, and HCO was detected above the 2σ level with a relative abundance N(HCO)/N(H2) = 1.1–1.3 × 10⁻⁹ along four sight lines, as detailed in Table 4. As noted there, HCO was previously detected toward BL Lac at EB−V = 0.32 mag with a relative abundance = 0.98 ± 0.02 × 10⁻⁹ based on the detection of all four hyperfine components. HCO is about one-third as abundant as HCO+ and 25 times more abundant than HOC+ (Liszt et al. 2004; Gerin et al. 2019).
Relative abundances of HCO.
3.4 Inter-relations in molecular species
Figure 3 plots the variation in C2H, HCN, and CS against HCO+in the left panel and the variation in HCO+, HCN, and CS against C2H in the right panel. The numerical values of statistical properties derived from these plots are given in Table 5. The slopes of the regression lines in the plots versus N(C2H) in the right panel are all steeper than those in the left panel, 1.01 versus 0.67, 1.40 versus 1.25, and 1.4 versus 1.1, from top to bottom.
The slope of the regression line fit of N(C2H) versus N(HCO+) in the top left panel is 0.67, which confirms the higher relative abundance ratio N(C2H)/N(HCO+) at smaller N(HCO+) seen in a substantial but smaller and more homogeneous earlier survey of high-latitude northern targets (Lucas & Liszt 2000). This nonlinearity means that the mean C2H/HCO+ ratio varies with the composition of the sample, and the current mean, <N(C2H)> <N(HCO+)> = 10.6, is slightly lower than the value <N(C2H)/N(HCO+)> = 14.5 quoted earlier.
HCN is detected down to N(HCO+) ≲ 4 × 1011 cm−2 with a tight correlation (r = 0.95) and without a break in the power-law slope (1.25 ± 0.06) of the HCN-HCO+ relation. Earlier, sparser data (Figure 3 of Lucas & Liszt 2002) seemed to show an abrupt increase in N(HCN) at N(HCO+) ≈ 1012 cm−2. The HCN/HCO+ abundance ratio was quoted earlier as 0.7–2.5 (their Table 1). The current sample mean is <N(HCN)> <N(HCO+)>= 1.25 ± 0.06, and a comparison of the Gaussian decomposition products gives a slightly higher number (Sect. 4), but the regression line in Fig. 3 is characterized by values below unity for N(HCO+) ≲ 1013 cm−2.
The upper limits on N(CS) in Chameleon and the values derived earlier by Lucas & Liszt (2002) are statistically significant in showing a deficiency at EB−V ≲ 0.5 mag relative to the regression line for the detections at higher extinction in Fig. 2. They are, however, too high to provide useful information for the CS chemistry of the sight lines at EB−V ≲ 0.5 mag given the plot in the lower right panel in Fig. 3. The integration times needed to study the other molecules were in general too brief to provide much useful information on CS beyond that noted in the Introduction.
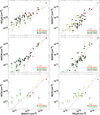 |
Fig. 3 Molecular column densities plotted against N(HCO+; left) and N(C2H; right). The regression lines include only data for which both molecules were detected. The values for the statistical parameters and the regression fits are given in Table 5. |
Mean line widths and column densities of the Gaussian components on 28 sight lines decomposed in HCO+and HCN.
Mean line widths and column densities for the Gaussian components on 31 sight lines decomposed in HCO+ and C2H.
4 Component decomposition
Figures 4 and 5 compare the results of a Gaussian decomposition of the new profiles of HCO+, HCN, and C2H. For each species, the decomposition simultaneously fit all kinematic components and hyperfine components by varying the central optical depth, central velocity, and profile FWHM while minimizing deviations from the observed line/continuum ratio exp(−τ). In this way, the quoted rms error estimates appropriately reflect the increased errors encountered when the line/continuum ratios were fit at high optical depth in a spectrum with a fixed rms flux/continuum noise level, and the uncertainty introduced by multiple components.
We used the results for HCO+ as an initial template for HCN and C2H in decompositions that considered all observed kinematic and hyperfine components. The hyperfine components of HCN and C2H were fit assuming optical depth ratios proportional to their intrinsic line strengths. The associated numerical results are given in Tables 6 and 7.
The results considered matched and unmatched components. The matched components are those for which the separation in central velocity is smaller than one-third of the FWHM of the narrower of the possible pair of components. Ambiguities are introduced in the case of weak broader components, and the component list was therefore ruthlessly purged to achieve a minimum set of matched lines. As noted below, the matched sets account for the vast majority of the aggregate optical depth in every species, including HCO+ whose profiles accommodate a much larger number of fitted components.
4.1 Line widths
The Gaussian components fit to CO absorption were unambiguously found to be 10–15% narrower than those of HCO+ along six sight lines in Chamaeleon (Liszt et al. 2019). The results for line width comparisons between HCO+ and HCN or C2H find small differences with a lower significance. In any case, the new results did not deviate from a linear proportionality of the derived FWHM (Tables 6 and 7).
The typical line widths of the matched components for all species observed here are very similar, 1 km s−1 while the matched HCN components are found to be 5% narrower on average than in HCO+ (upper left panel in Figure 4 and Table 6). As shown in Table 6, HCO+ was decomposed into many more components than HCN along the 28 sight lines decomposed in HCO+ and HCN (107 versus 55), but the 52 unmatched components in HCO+ represent only 12% of the aggregate HCO+ absorption, and the four unmatched components of HCN represent 2% of the HCN absorption. The unmatched HCO+ components are much weaker and somewhat broader than average, as is the case for the unmatched HCN components.
Absorption from C2H is intrinsically weaker than in HCO+ or HCN, and somewhat different results were obtained when we compared HCO+ and C2H along 31 sight lines that were decomposed in both species. For C2H, 73 of 119 HCO+ components were matched with 73 of 81 components fit to C2H (Figure 4 in the bottom panel and Table 7), and C2H is 12% broader, with considerably more scatter than for the comparison of HCO+ and HCN.
HCO+ is more easily detected owing to its higher dipole moment and lack of hyperfine structure, and the many weak broad unmatched HCO+ components result in a cumulative distribution function for HCO+ that is shifted to higher line widths in Figure 5 in the left panel, where all components that we fit to each species were used to construct the cumulative distribution function, not only the components that were matched in two species.
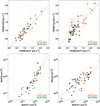 |
Fig. 4 Results of the Gaussian component fitting. Top: FWHM of the Gaussian components fit to spectra of HCN and C2H compared with those fit to HCO+. The solid black line shows the regression fit in each case, and the dashed light gray line shows the locus of the equal FWHM. The numerical quantities derived from the fitting are given in Tables 6 and 7. Bottom: column densities. |
4.2 Component column densities
The component column densities are shown in the bottom panel in Figure 4 and are summarized quantitatively in Tables 6 and 7. The fits mimic the behavior seen in Figure 3 and Table 5, with power-law slopes ≈1.2 and 0.7 for HCN and C2H, respectively. More HCO+ components were matched in C2H than in HCN (73 of 119 versus 55 of 107), with many matched components at N(HCO+) < 1012 cm−2. The mean HCO+ column density of components matched in HCN, 1.26 × 1012 cm−2, is larger by one-third than that for components matched in C2H (0.92 × 1012 cm−2; Table 7). The relative abundance ratio of the weakest matched components N(C2H)/N(HCO+) ≈100 exceeds the overall mean <N(C2H)> <N(HCO+)>≈ 25 by far.
5 HCO+ and CO in absorption and emission
Seven of the Galactic anticenter sight lines were newly observed in 13CO and HCO+ emission, as shown in Figure 6. The comparison of HCO+ observed in emission and absorption can be used to determine the excitation temperature of the J=1–0 transition of HCO+ and the volume density of the host gas. The comparisons of HCO+, 12CO and 13CO in various combinations of emission and absorption reveal information on the overall character of the gas as seen in CO: the CO brightness, 12CO/13CO ratio, and CO-H2 conversion factor at which the molecular gas is found.
The results are presented in two formats. In one format, ALMA and IRAM 30m profiles were interpolated onto common spectral grids for a channel-to-channel comparison of the new results between species and tracers. In the other format, the results integrated across whole profiles are shown for the larger sample that includes older data.
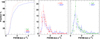 |
Fig. 5 line width probability distributions for all components fit to each species. Left: cumulative distributions for HCO+, HCN, and C2H. Middle: fractional distributions of individual HCO+ and HCN line widths. Right: fractional distributions of HCO+ and C2H line widths. |
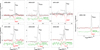 |
Fig. 6 Emission profiles of 12CO(black), 13CO(gray and gray shaded), HCO+(green), and HCO+ absorption (red). The emission profiles were normalized as shown. The CO emission profiles were folded in frequency, resulting in negative artifacts at velocities not associated with other material. |
5.1 HCO+ compared in absorption and emission
The left panel of Figure 7 shows the brightness of the HCO+ emission plotted against the HCO+ optical depth on a channel-by-channel basis. Emission is detected in a statistical sense at optical depths τ ≳ 0.05. The emission toward J0502 is much brighter than in any other source and accounts for almost 50% of all emission. For most sources, the excitation temperature inferred from the regression line passing through 0.015 K emission brightness at τ = 1 is 2.758 K. For J0502, the excitation temperature corresponding to a brightness of 0.09 K at τ = 2 is 2.855 K.
The right panel of Figure 7 plots the integrated HCO+ emission brightness and optical depth for the new and old results together with iso-density lines derived from the weak excitation limit (including electrons) in the discussion of the detectability of millimeter-wave emission by Liszt & Pety (2016). When the collisional excitation of a species is sufficiently far below thermalization, all energy deposited in the rotation ladder by collisions escapes the medium, regardless of the optical depth. The emission line brightness is determined by the product of the column density of the molecule, the mean hydrogen number density, and an effective excitation rate coefficient that includes all upward collisional excitations into whatever energy levels. The rate coefficient is 30–100 times larger under diffuse gas conditions where the ionization fraction exceeds 10−4 compared to fully molecular gas, where CO dominates the carbon budget and the ionization fraction is 10−7 or smaller.
Almost all sources fall in the range n(H) = 50–200 cm−3, with n(H) = 500 cm−3 toward J0502. Similar densities in diffuse molecular gas were inferred by Neufeld et al. (2024) from a study of excitation in C2.
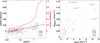 |
Fig. 7 HCO+ emission plotted against absorption. Left: channel values of emission brightness and absorption for the new data shown in Figure 6. The excitation temperature corresponding to the regression line is 2.758 K. Right: integrated emission brightness against integrated absorption ϒHCO+ for the new and old data. Superposed at the right are the locii of constant number density n(H) for diffuse purely molecular gas using results for the weak excitation limit (including electrons) described by Liszt & Pety (2016) (see Section 5.1 for an explanation of the underlying physics). |
5.2 HCO+ absorption and CO emission
Figure 8 relates the HCO+ emission brightness to the 12CO emission. The typical brightness ratios for the new line profiles on a channel-channel basis in the left panel are in the range 1/200– 1/50, and half the aggregate HCO+ emission occurs at 12CO brightness WCO ≤2.3 K. The right panel in Figure 8 places the new results in a broader context by combining the new results with integrated profile results reported away from continuum background sources by Liszt (2020) that extend to higher values of the brightnesses. There is a wide range of HCO+ brightness at WCO ≳ 6 K-km s−1 but it is within the typical range 1/200–1/50.
5.3 Host of H2
The optical depth is proportional to the column density per unit velocity, and Figure 9 shows the HCO+ optical depth scaled to dN(H2)/dv and plotted against several quantities related to the CO emission on a channel-by-channel basis. The 12CO emission brightness (left), the CO-H2 conversion factor (middle; derivable from the left plot), and against the 13CO/12CO brightness ratio (left).
The middle panel of Figure 9 shows that most of the H2 is found at CO-H2 conversion factors in the range 1–4 ×10²⁰H2 cm−2 (K-km s−1)−1, but J0439 has only very weak 12CO emission and a much higher ratio 9 × 10²⁰H2 cm−2 (K-km s−1)−1.
The right panel in Figure 9 shows that half the total amount of H2 occurs at 12CO/13CO brightness ratios at or above 20 and 80% above a ratio of 10, indicating the diffuse nature of the gas and the general absence of saturation in 12CO. The 12CO/13CO ratio is expected to have been substantially diminished by fractionation resulting from C+ exchange.
6 Summary
We joined recent ALMA observations (Table 1) with older absorption data taken at the IRAM Plateau de Bure Interferometer (PdBI) and Northern Extended Millimeter Array (NOEMA) telescopes to analyze a larger body of absorption spectra of HCO+, C2H, HCN, CS, and HCO arising in diffuse interstellar gas seen toward compact extragalactic continuum sources. The sight lines in the sample are slightly overabundant on average in EB−V compared to the Galactic average (Figure 1, Section 3.1) and richer in reddening than in the column density of atomic hydrogen. This implies that the sample is not only rich in gas and dust, but has a higher fraction of H2. The distribution of EB−V with sin(|b|) has a higher scatter than that of N(HI), which can be understood given the large scatter in the plots of N(H2) and integrated CO emission WCO.
Figure 2 plots the column densities of HCO+, C2H, HCN, and CS against EB−V (see Section 3.2 and Table 2). Absorption from HCO+, the most ubiquitous species (72 of 86 sight lines; Table 3), was uniformly detected at EB−V ≳ 0.2 mag and was detected more rarely down to EB−V = 0.07 mag, where H2 first becomes a substantial component of the ISM. C2H is ubiquitous, and N(C2H)/N(HCO+) increases at smaller N(HCO+), but C2H was detected slightly less frequently than HCO+ (53 of 76 sight lines) because C2H absorption is intrinsically weaker and harder to detect. The so-called dense-gas tracer HCN was uniformly detected down to EB−V = 0.3 mag and occasionally seen even below EB−V = 0.1 mag. It was uniformly detected at N(H2) ≳ 1020 cm−2 with little change in the relative abundance N(HCN)/N(HCO+) ≈ 1.25 or N(HCN)/N(H2) = 3.75 × 10⁻⁹.
We presented no new detections of CS, which we failed to detect along all 13 sight lines we studied in the outskirts of Chamaeleon (owing to a lack of sensitivity), and which we sub-sequently did not observe in the Galactic anticenter. The upper limits achieved in the Chamaeleon study show, however, that the relative abundance of CS is lower at the low-EB−V end of our sample at EB−V ≲ 1 mag (Fig. 2) and perhaps (Fig. 3) when N(HCO+) ≲ 2 × 1012 cm−2.
HCO is ubiquitous in the diffuse ISM with N(HCO)/N(HCO+) = 1/3 or N(HCO)/N(H2) = 1 × 10⁻⁹, but the strongest hyperfine component of HCO is only about 2% as strong in absorption as HCO+ and was only detected along the four ALMA sight lines with a signal-to-noise ratio of 100:1 or more in HCO+ (Table 5).
Figure 3 (see Section 3.3 and Table 5) shows the interrelations among the column densities of HCO+, C2H, HCN, and CS. HCN is detected almost without exception down to N(HCO+) = 3 × 1011 cm−2 or N(H2) = 1020 cm−2, in contrast to earlier results that implied that N(HCN)/N(HCO+) increased abruptly at N(HCO+) = 1012 cm−2. The bottom panel in Figure 3 shows that the lack of detections of CS at EB−V < 0.5 mag might result from a lack of sensitivity, because the observed upper limits on N(CS) are higher than the values expected from extrapolating the detections at higher N(HCO+) and N(C2H).
In Section 4, we discussed the Gaussian decomposition of ALMA profiles of HCO+, C2H, and HCN by comparing the numbers and line widths of kinematic components in Figures 4 and 5 and Tables 6 and 7. The typical line widths for all species are 1 km s−1. HCO+ is the most widely detected species as a result of its high dipole moment and lack of hyperfine structure, and its spectra are richer and decomposed into more components than in C2H or HCN. For HCN (Table 7), 55 of 59 HCN components seen along 28 sight lines were matched against 55 of 107 components in HCO+, and the matched HCN components were found to be 5% narrower on average (0.975 versus 1.032 km s−1). The unmatched components are weaker and broader than average and constitute small fractions of the total absorption in either species. For C2H (Figures 4 and 5 and Table 7) 73 of 81 components were matched against 73 of 119 HCO+ components along 31 sight lines, and the matched C2H components are 12% broader, 1.12 versus 1.03 km s−1. The unmatched components constitute a small fraction of the total absorption.
In Section 5, we discussed new observations of HCO+ and CO emission along seven outer Galaxy sight lines (Figure 6). A channel-by-channel comparison of the HCO+ emission and absorption showed (Figure 7, left) that HCO+ emission is detected in a statistical sense at HCO+ optical depths as low as 0.05, and the great majority of channels imply a typical excitation temperature of 2.76 K up to τ = 2. Stronger emission with an excitation temperature 2.86 K was seen on the sight line to J0502. Deriving N(HCO+) in the limit of no collisional excitation is a good approximation.
The comparison of the integrated HCO+ emission and absorption (Figure 7, right) showed that the mean hydrogen volume density falls in the range n(H) = 50–200 cm−3 on six of the seven sight lines, with n(H) = 500 cm−3 toward J0502, where the HCO+ emission is brighter.
The brightness ratio of the HCO+ emission to that of CO is generally within a factor of two of 1% for gas seen near the continuum background targets (Figure 8, left). Most of the HCO+ emission arises in channels in which the CO brightness is 2 K or lower.
In Section 5.1 (Figure 9) we related the H2 content to the nature of the host gas as characterized by different aspects of the CO emission. Nearly half of the total amount of H2 arises in line channels with a CO brightness of ≲2 K (Figure 9, left) and about 80% with CO-H2 conversion factors N(H2)/WCO = 1– 45 × 1020 H2 (K-km s−1)−1 and 12CO/13CO emission brightness ratios above 10.
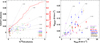 |
Fig. 8 Comparison of emission brightness for HCO+ and 12CO. Left: channel-channel comparison for the six new anticenter sources with WCO > 1 K-km s−1. Right: integrated HCO+ emission plotted against WCO with new data from this work overlaid on earlier observations taken around and well removed from continuum background sources. This was previously shown as Figure 8 in Liszt (2020). |
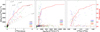 |
Fig. 9 Channel-by-channel comparison with values of the HCO+ absorption scaled to H2. The fat red curve in each panel is the fractional cumulative distribution, which is to be read against the red scale at the right. |
Acknowledgements
The National Radio Astronomy Observatory is a facility of the National Science Foundation, operated by Associated Universities, Inc. This work was supported by the French program “Physique et Chimie du Milieu Interstellaire” (PCMI) funded by the Conseil National de la Recherche Scientifique (CNRS) and Centre National d’Etudes Spatiales (CNES). This work is based in part on observations carried out under project number 003-19 with the IRAM 30m telescope]. IRAM is supported by INSU/CNRS (France), MPG (Germany) and IGN (Spain). This paper makes use of the following ALMA data ADS/JAO.ALMA#2016.1.00132.S ADS/JAO.ALMA#2016.1.00714.S ADS/JAO.ALMA#2018.1.00115.S ADS/JAO.ALMA#2019.1.00120.S ALMA is a partnership of ESO (representing its member states), NSF (USA) and NINS (Japan), together with NRC (Canada), NSC and ASIAA (Taiwan), and KASI (Republic of Korea), in cooperation with the Republic of Chile. The Joint ALMA Observatory is operated by ESO, AUI/NRAO and NAOJ. We thank the referee for a close reading that resulted in a significantly improved presentation.
Appendix A Data sources
The new and old data sources are described in Section 2.1 and Table A.1
Line of sight properties, HCO+ column densities and new results for HCN and C2H
Appendix B Line of sight properties: HCO+, HCN and C2H
New results for HCO+, HCN and C2H are summarized in Table B.1
Data sources
Appendix C Spectra of C2H
Recent ALMA absorption spectra of C2H are shown in Figure C.1
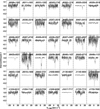 |
Fig. C.1 Spectra of C2H absorption. Spectra along 4 sight lines lacking apparent detections are not shown. See Table 1 for quantitative results and Table 4 for the statistics of detection rates. |
Appendix D Spectra of HCN
Recent ALMA absorption spectra of HCN are shown in Figure D.1
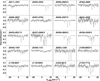 |
Fig. D.1 ALMA spectra of HCN absorption including all statistically significant detections. Some spectra have been scaled as indicated in those panels. See Table 1 for quantitative results and Table 4 for the statistics of detection rates. |
Appendix E Spectra of HCO
Recent ALMA absorption spectra of HCO are shown in Figure E.1 for the sight lines noted in Table 5
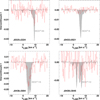 |
Fig. E.1 ALMA spectra of HCO absorption shown as red histograms superposed on scaled profiles of HCO+ absorption shown as gray histograms. |
Appendix F Forming emission spectra in the presence of a continuum background
In Section 5 we discussed the excitation of HCO+ based on comparison of emission and absorption spectra of HCO+ and CO. Because the emitted and absorbed fluxes of HCO+ lines are by coincidence comparable at most millimeter-wave telescopes, pure emission profiles cannot be obtained directly toward the continuum Lucas & Liszt (1996). Instead we observed at positions displaced from the continuum by 1.2 HPBW = 30′′ in each of the four cardinal directions, similar to Lucas & Liszt (1996). Spectra around J0426+2327 are shown in Figure A.4. The individual HCO+ spectra at right are noisy but see the average in Figure 6
Mixing of emission and absorption is not an issue for the much stronger CO emission lines that are shown at left in Figure F.1. The spectra toward and displaced 1 HPBW = 22′′ from the continuum differ little so we averaged all five positions to form the 12CO and 13CO spectra shown in Figure 6
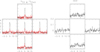 |
Fig. F.1 Individual spectra used to form the average spectra toward J0426+2327 as discussed in Section 5 and shown in Figure 7. 12CO (black) and 13CO spectra shown in red and scaled upward by factor 5 are shown at left and HCO+ spectra are shown at right. |
Although the averaged CO and HCO+ spectra discussed in Section 5 were derived over slightly regions they (as earlier) seem to present a coherent picture of the HCO+ excitation.
References
- Bigiel, F., Leroy, A. K., & Jiménez-Donaire, M. J., et al. 2016, ApJ, 822, L26 [NASA ADS] [CrossRef] [Google Scholar]
- Bohlin, R. C., Savage, B. D., & Drake, J. F. 1978, ApJ, 224, 132 [Google Scholar]
- Gerin, M., & Liszt, H. 2017, A&A, 600, A48 [NASA ADS] [CrossRef] [EDP Sciences] [Google Scholar]
- Gerin, M., Liszt, H., & Neufeld, D., et al. 2019, A&A, 622, A26 [NASA ADS] [CrossRef] [EDP Sciences] [Google Scholar]
- Gerin, M., Liszt, H., Pety, J., & Faure, A. 2024, A&A, 686, A49 [NASA ADS] [CrossRef] [EDP Sciences] [Google Scholar]
- Grenier, I. A., Casandjian, J.-M., & Terrier, R. 2005, Science, 307, 1292 [Google Scholar]
- Kalberla, P. M. W., Burton, W. B., & Hartmann, D., et al. 2005, A&A, 440, 775 [NASA ADS] [CrossRef] [EDP Sciences] [Google Scholar]
- Lallement, R., Vergely, J. L., Babusiaux, C., & Cox, N. L. J. 2022, A&A, 661, A147 [NASA ADS] [CrossRef] [EDP Sciences] [Google Scholar]
- Liszt, H. S. 2020, ApJ, 897, 104 [Google Scholar]
- Liszt, H., & Gerin, M. 2018, A&A, 610, A49 [NASA ADS] [CrossRef] [EDP Sciences] [Google Scholar]
- Liszt, H., & Gerin, M. 2023a, ApJ, 943, 172 [NASA ADS] [CrossRef] [Google Scholar]
- Liszt, H., & Gerin, M. 2023b, A&A, 675, A145 [NASA ADS] [CrossRef] [EDP Sciences] [Google Scholar]
- Liszt, H., & Lucas, R. 2001, A&A, 370, 576 [NASA ADS] [CrossRef] [EDP Sciences] [Google Scholar]
- Liszt, H. S., & Pety, J. 2012, A&A, 541, A58 [NASA ADS] [CrossRef] [EDP Sciences] [Google Scholar]
- Liszt, H. S., & Pety, J. 2016, ApJ, 823, 124 [NASA ADS] [CrossRef] [Google Scholar]
- Liszt, H., Lucas, R., & Black, J. H. 2004, A&A, 428, 117 [CrossRef] [EDP Sciences] [Google Scholar]
- Liszt, H., Lucas, R., & Pety, J. 2006, A&A, 448, 253 [CrossRef] [EDP Sciences] [Google Scholar]
- Liszt, H. S., Pety, J., & Lucas, R. 2010, A&A, 518, A45 [NASA ADS] [CrossRef] [EDP Sciences] [Google Scholar]
- Liszt, H., Sonnentrucker, P., Cordiner, M., & Gerin, M. 2012, ApJ, 753, L28 [NASA ADS] [CrossRef] [Google Scholar]
- Liszt, H. S., Pety, J., Gerin, M., & Lucas, R. 2014, A&A, 564, A64 [NASA ADS] [CrossRef] [EDP Sciences] [Google Scholar]
- Liszt, H., Gerin, M., & Grenier, I. 2018, A&A, 617, A54 [NASA ADS] [CrossRef] [EDP Sciences] [Google Scholar]
- Liszt, H., Gerin, M., & Grenier, I. 2019, A&A, 627, A95 [NASA ADS] [CrossRef] [EDP Sciences] [Google Scholar]
- Lucas, R., & Liszt, H. S. 1996, A&A, 307, 237 [Google Scholar]
- Lucas, R., & Liszt, H. S. 2000, A&A, 358, 1069 [NASA ADS] [Google Scholar]
- Lucas, R., & Liszt, H. S. 2002, A&A, 384, 1054 [NASA ADS] [CrossRef] [EDP Sciences] [Google Scholar]
- Narita, K., Sakamoto, S., & Koda, J., et al. 2024, ApJ, 969, 102 [NASA ADS] [CrossRef] [Google Scholar]
- Nash, A. G. 1990, ApJS, 72, 303 [NASA ADS] [CrossRef] [Google Scholar]
- Neufeld, D. A., Welty, D. E., Ivlev, A. V., et al. 2024, ApJ, 973, 143 [Google Scholar]
- Planck Collaboration Int. XXVIII. 2015, A&A, 582, A31 [NASA ADS] [CrossRef] [EDP Sciences] [Google Scholar]
- Remy, Q., Grenier, I. A., Marshall, D. J., & Casandjian, J. M. 2017, A&A, 601, A78 [NASA ADS] [CrossRef] [EDP Sciences] [Google Scholar]
- Remy, Q., Grenier, I. A., Marshall, D. J., & Casandjian, J. M. 2018, A&A, 611, A51 [NASA ADS] [CrossRef] [EDP Sciences] [Google Scholar]
- Savage, B. D., Drake, J. F., Budich, W., & Bohlin, R. C. 1977, ApJ, 216, 291 [NASA ADS] [CrossRef] [Google Scholar]
- Schlegel, D. J., Finkbeiner, D. P., & Davis, M. 1998, ApJ, 500, 525 [Google Scholar]
- Sun, M., Jiang, B., Zhao, H., & Ren, Y. 2021, ApJS, 256, 46 [NASA ADS] [CrossRef] [Google Scholar]
- Voirin, J., Manara, C. F., & Prusti, T. 2018, A&A, 610, A64 [NASA ADS] [CrossRef] [EDP Sciences] [Google Scholar]
- Yan, Q.-Z., Zhang, B., & Xu, Y., et al. 2019, A&A, 624, A6 [NASA ADS] [CrossRef] [EDP Sciences] [Google Scholar]
- Zucker, C., Speagle, J. S., & Schlafly, E. F., et al. 2019, ApJ, 879, 125 [NASA ADS] [CrossRef] [Google Scholar]
All Tables
Mean line widths and column densities of the Gaussian components on 28 sight lines decomposed in HCO+and HCN.
Mean line widths and column densities for the Gaussian components on 31 sight lines decomposed in HCO+ and C2H.
Line of sight properties, HCO+ column densities and new results for HCN and C2H
All Figures
|
Fig. 1 Galactic-scale properties of the sample. We plot against sin(|b|) EB−V (top left), N(HI) (top right), N(H2) = N(HCO+)/3 ×10−9 (bottom left), and WCO, the line profile integral of the CO J=1–0 emission. The sight lines that were not detected in HCO+ absorption are shown as smaller green symbols in the upper two panels. The smaller green symbols in the lower panels are the 3σ upper limits on the plotted quantity. The solid line in each panel is a regression line: A plane-parallel vertically stratified Galactic gas layer would exhibit a power-law slope of –1. We also show averages at intervals of 0.01 in sin(|b|) in blue at the top. A legend marking the values of the Galactic latitude is inset near the top of the upper two panels. The values for the statistical parameters and the regression fits are given in Table 1. |
| In the text | |
|
Fig. 2 Molecular column densities plotted against EB−V from Schlegel et al. (1998). The associated datasets are indicated (see Section 2.4). The solid line in each panel is a regression line for the sight lines with detections of both plotted quantities. The values for the statistical parameters and the regression fits are given in Table 2, and the statistical detection rates are given in Table 3. |
| In the text | |
|
Fig. 3 Molecular column densities plotted against N(HCO+; left) and N(C2H; right). The regression lines include only data for which both molecules were detected. The values for the statistical parameters and the regression fits are given in Table 5. |
| In the text | |
|
Fig. 4 Results of the Gaussian component fitting. Top: FWHM of the Gaussian components fit to spectra of HCN and C2H compared with those fit to HCO+. The solid black line shows the regression fit in each case, and the dashed light gray line shows the locus of the equal FWHM. The numerical quantities derived from the fitting are given in Tables 6 and 7. Bottom: column densities. |
| In the text | |
|
Fig. 5 line width probability distributions for all components fit to each species. Left: cumulative distributions for HCO+, HCN, and C2H. Middle: fractional distributions of individual HCO+ and HCN line widths. Right: fractional distributions of HCO+ and C2H line widths. |
| In the text | |
|
Fig. 6 Emission profiles of 12CO(black), 13CO(gray and gray shaded), HCO+(green), and HCO+ absorption (red). The emission profiles were normalized as shown. The CO emission profiles were folded in frequency, resulting in negative artifacts at velocities not associated with other material. |
| In the text | |
|
Fig. 7 HCO+ emission plotted against absorption. Left: channel values of emission brightness and absorption for the new data shown in Figure 6. The excitation temperature corresponding to the regression line is 2.758 K. Right: integrated emission brightness against integrated absorption ϒHCO+ for the new and old data. Superposed at the right are the locii of constant number density n(H) for diffuse purely molecular gas using results for the weak excitation limit (including electrons) described by Liszt & Pety (2016) (see Section 5.1 for an explanation of the underlying physics). |
| In the text | |
|
Fig. 8 Comparison of emission brightness for HCO+ and 12CO. Left: channel-channel comparison for the six new anticenter sources with WCO > 1 K-km s−1. Right: integrated HCO+ emission plotted against WCO with new data from this work overlaid on earlier observations taken around and well removed from continuum background sources. This was previously shown as Figure 8 in Liszt (2020). |
| In the text | |
|
Fig. 9 Channel-by-channel comparison with values of the HCO+ absorption scaled to H2. The fat red curve in each panel is the fractional cumulative distribution, which is to be read against the red scale at the right. |
| In the text | |
|
Fig. C.1 Spectra of C2H absorption. Spectra along 4 sight lines lacking apparent detections are not shown. See Table 1 for quantitative results and Table 4 for the statistics of detection rates. |
| In the text | |
|
Fig. D.1 ALMA spectra of HCN absorption including all statistically significant detections. Some spectra have been scaled as indicated in those panels. See Table 1 for quantitative results and Table 4 for the statistics of detection rates. |
| In the text | |
|
Fig. E.1 ALMA spectra of HCO absorption shown as red histograms superposed on scaled profiles of HCO+ absorption shown as gray histograms. |
| In the text | |
|
Fig. F.1 Individual spectra used to form the average spectra toward J0426+2327 as discussed in Section 5 and shown in Figure 7. 12CO (black) and 13CO spectra shown in red and scaled upward by factor 5 are shown at left and HCO+ spectra are shown at right. |
| In the text | |
Current usage metrics show cumulative count of Article Views (full-text article views including HTML views, PDF and ePub downloads, according to the available data) and Abstracts Views on Vision4Press platform.
Data correspond to usage on the plateform after 2015. The current usage metrics is available 48-96 hours after online publication and is updated daily on week days.
Initial download of the metrics may take a while.