Open Access
Fig. 6
Download original image
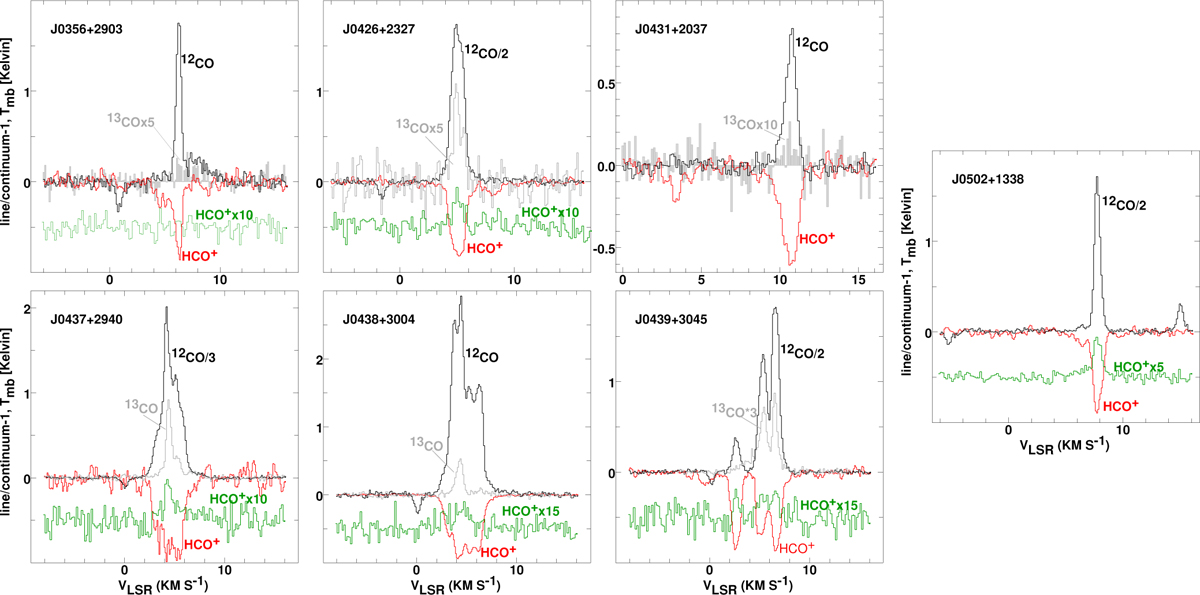
Emission profiles of 12CO(black), 13CO(gray and gray shaded), HCO+(green), and HCO+ absorption (red). The emission profiles were normalized as shown. The CO emission profiles were folded in frequency, resulting in negative artifacts at velocities not associated with other material.
Current usage metrics show cumulative count of Article Views (full-text article views including HTML views, PDF and ePub downloads, according to the available data) and Abstracts Views on Vision4Press platform.
Data correspond to usage on the plateform after 2015. The current usage metrics is available 48-96 hours after online publication and is updated daily on week days.
Initial download of the metrics may take a while.