Fig. 1
Download original image
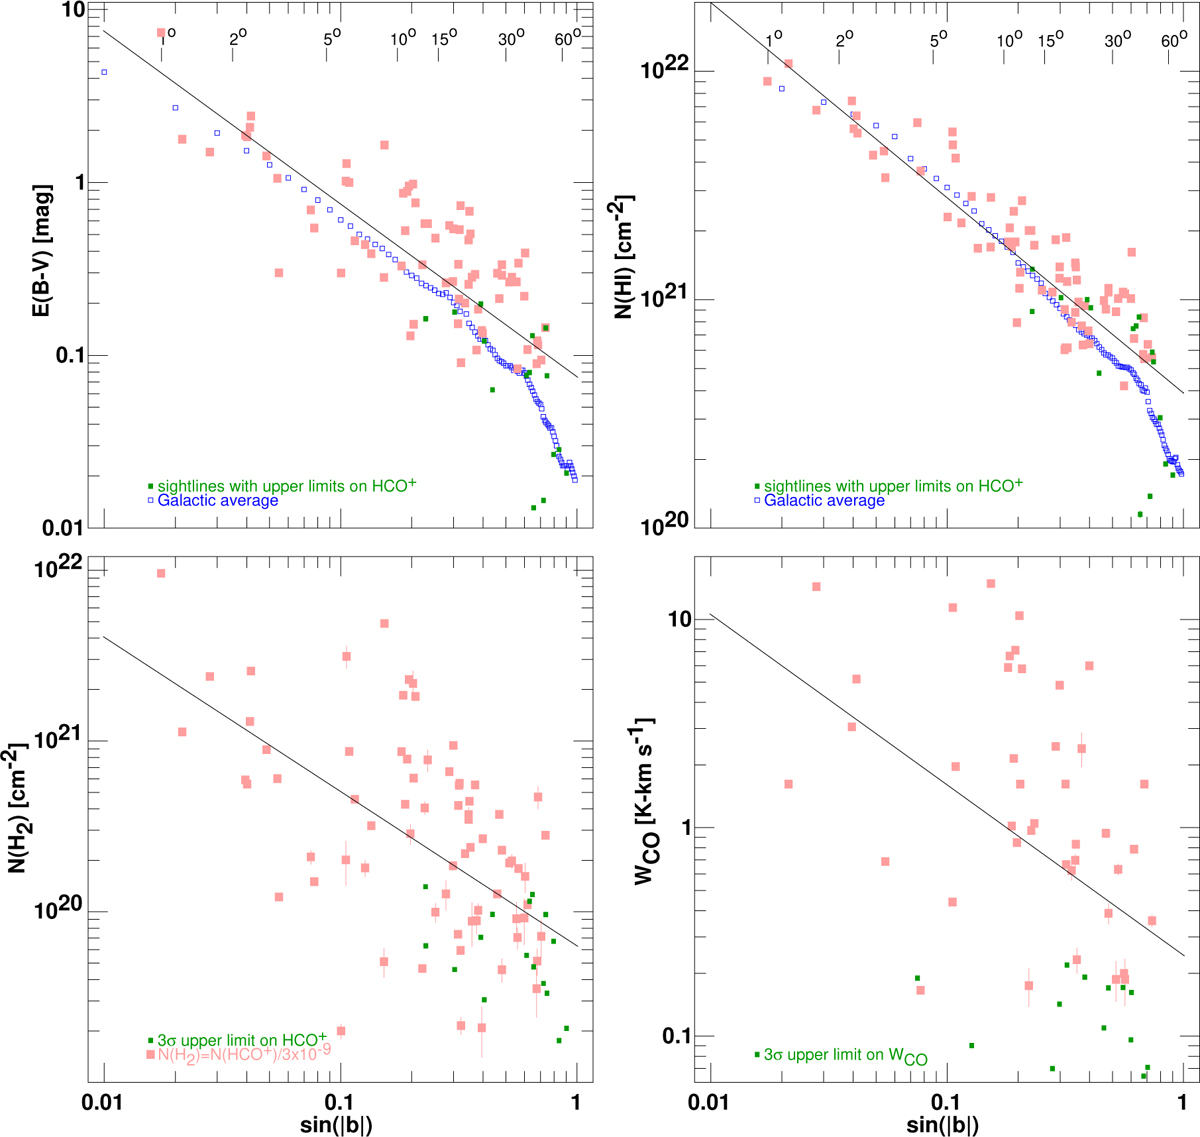
Galactic-scale properties of the sample. We plot against sin(|b|) EB−V (top left), N(HI) (top right), N(H2) = N(HCO+)/3 ×10−9 (bottom left), and WCO, the line profile integral of the CO J=1–0 emission. The sight lines that were not detected in HCO+ absorption are shown as smaller green symbols in the upper two panels. The smaller green symbols in the lower panels are the 3σ upper limits on the plotted quantity. The solid line in each panel is a regression line: A plane-parallel vertically stratified Galactic gas layer would exhibit a power-law slope of –1. We also show averages at intervals of 0.01 in sin(|b|) in blue at the top. A legend marking the values of the Galactic latitude is inset near the top of the upper two panels. The values for the statistical parameters and the regression fits are given in Table 1.
Current usage metrics show cumulative count of Article Views (full-text article views including HTML views, PDF and ePub downloads, according to the available data) and Abstracts Views on Vision4Press platform.
Data correspond to usage on the plateform after 2015. The current usage metrics is available 48-96 hours after online publication and is updated daily on week days.
Initial download of the metrics may take a while.